ANALYSIS OF LAND-USE CHANGE EFFECT UPON RIVER DISCHARGE - APPLICATION... HYDROLOGICAL WATERSHED MODEL WITH INTEGRATION OF REMOTE SENSING AND GIS-
advertisement
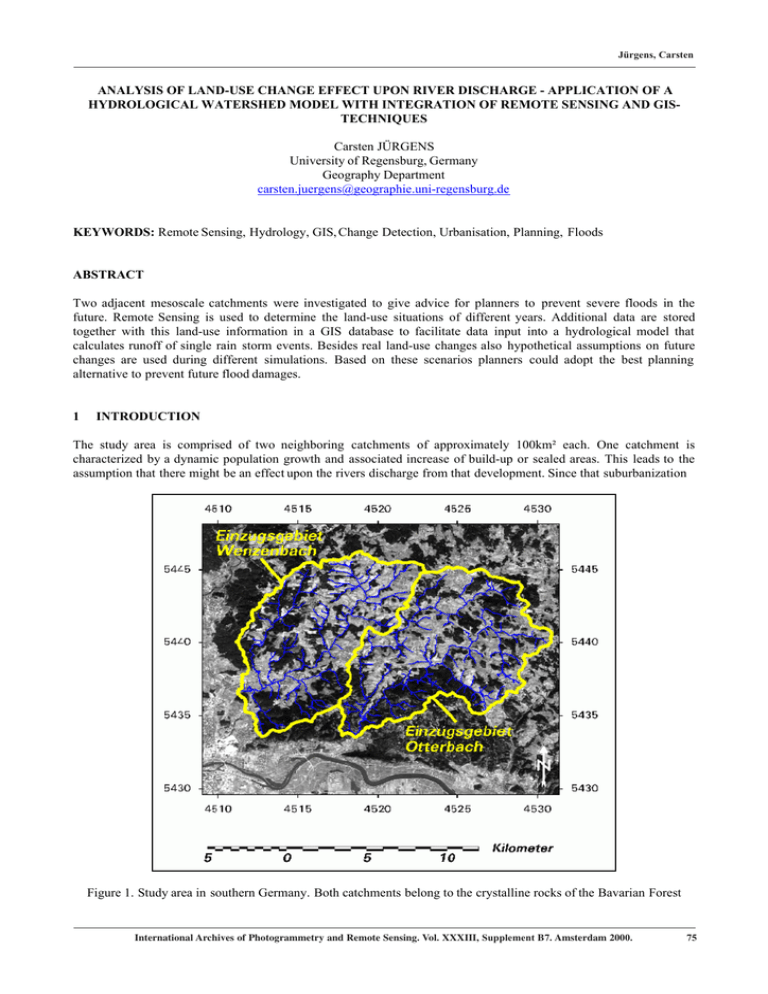
Jürgens, Carsten ANALYSIS OF LAND-USE CHANGE EFFECT UPON RIVER DISCHARGE - APPLICATION OF A HYDROLOGICAL WATERSHED MODEL WITH INTEGRATION OF REMOTE SENSING AND GISTECHNIQUES Carsten JÜRGENS University of Regensburg, Germany Geography Department carsten.juergens@geographie.uni-regensburg.de KEYWORDS: Remote Sensing, Hydrology, GIS, Change Detection, Urbanisation, Planning, Floods ABSTRACT Two adjacent mesoscale catchments were investigated to give advice for planners to prevent severe floods in the future. Remote Sensing is used to determine the land-use situations of different years. Additional data are stored together with this land-use information in a GIS database to facilitate data input into a hydrological model that calculates runoff of single rain storm events. Besides real land-use changes also hypothetical assumptions on future changes are used during different simulations. Based on these scenarios planners could adopt the best planning alternative to prevent future flood damages. 1 INTRODUCTION The study area is comprised of two neighboring catchments of approximately 100km² each. One catchment is characterized by a dynamic population growth and associated increase of build-up or sealed areas. This leads to the assumption that there might be an effect upon the rivers discharge from that development. Since that suburbanization Figure 1. Study area in southern Germany. Both catchments belong to the crystalline rocks of the Bavarian Forest International Archives of Photogrammetry and Remote Sensing. Vol. XXXIII, Supplement B7. Amsterdam 2000. 75 Jürgens, Carsten process continues, one wishes to know what could possibly happen in the future. Therefore different simulation scenarios were applied to continue development but prevent flood damage (Jürgens, 1999a,b). 2 STUDY OBJECTIVE The study area (Fig. 1) belongs to the rural urban interface of the city of Regensburg in southern Germany. Agricultural fields dominate the land-use, with scattered rural villages and small towns. These villages and towns typically show a low building density. This results in a high degree of mixed pixels from the different materials and surfaces. The agricultural fields consist of small parcels with an average size of less than two hectares. Since the land-use (together with the soil) is a hydrological key variable, a precise land-cover/land-use classification was necessary. The results of each classification and the changes from 1987 to 1993 had to be integrated into a GIS. The GIS database was then used to feed the spatially distributed hydrological model. After model validation different hypothetical land-use scenarios had to be calculated to be able to evaluate the catchments behavior upon land-use changes in terms of runoff (Fig. 2). Land Use Data 1987 vs. 1993 Land Use Scenarios Add‘l Spatial Data - Soil Physics - River Network - Digital Elevation Model - Rain Gage Network GIS SPATIAL DATA Time Dependent Data - Precipitation Data - Soil Moisture Data ANSWERS HYDROLOGICAL MODEL Runoff Results - 1987/1993Situations - Simulated Scenarios HYDROLOGICAL DATA (TIME INDEPENDENT) Figure 2. Components of the study 3 LAND-USE/LAND-COVER CLASSIFICATIONS Since the official statistics do not clearly separate sealed surfaces from other surfaces, one had to consider remote sensing data to get this information. In addition to this problem of nomenclature, one does not know the exact location of sealed surfaces from the statistics. Remote sensing offers the opportunity to use spectral information to extract sealed surfaces from the image and determine their location precisely. For this study this was of great importance. Due to the small agricultural fields and the low density build-up structures a pixel size of 10m seemed necessary (Jürgens, 2000a,b). To be able to use consistent data sets on the one hand and to cover a long time span on the other hand, the only data sets one could consider were a combination of LANDSAT TM and SPOT Pan images. Due to cloud cover conditions 76 International Archives of Photogrammetry and Remote Sensing. Vol. XXXIII, Supplement B7. Amsterdam 2000. Jürgens, Carsten the years 1987 and 1993 were selected from the image archives. For both dates a merge data set was calculated from the SPOT Pan data and two LANDSAT TM images of spring and summer of each year. The merge procedure was necessary to cope with the small parcels and the rural settlement structures. For each year an unsupervised bi-temporal land-use/land-cover classification was calculated (Fig. 3). The spectral classification did not separate the villages as needed. Thus a variance filter procedure was applied to get better results from the imagery. This hierarchical classification approach resulted in a mean classification accuracy of 89.2% for 1987 and 90.4% for 1993 (Jürgens, 1999a, 2000a). The most significant land-use changes appeared in the build-up areas. From 1987 to 1993 the build-up areas increased. Especially agricultural fields and to a lesser extent forests were converted into build-up areas. Wenzenbach Otterbach 1993 Forest Pasture build-up/impervious areas Potatoes Cereals and Rape Corn/Maize set-aside land Water Figure 3. Land-use/land-cover classification of 1993 4 THE HYDROLOGICAL MODEL The hydrological model used for this study was the Areal Nonpoint Source Watershed Response Environment Simulation (ANSWERS) model (Beaseley & Huggins, 1991). The ANSWERS model is a single event model that allows distributed modelling. This physically-based, conceptual model treats raster cells from one to four hectare in size. In this study the smallest size of one hectare was used to keep as much detail as possible. The model can handle up to 10,000 raster elements and allows to consider spatio-temporal precipitation patterns. All time invariant variables such as soil data, land-use, etc. are prepared using GIS-features. The time variant parameters such as precipitation or soil moisture data are entered directly into the ANSWERS model. The model calculates the water flow through the catchment according to its characteristics (soil, slope, land-use, etc.) and gives the discharge values at the outlet of the watershed. From these values runoff-curves can be obtained. International Archives of Photogrammetry and Remote Sensing. Vol. XXXIII, Supplement B7. Amsterdam 2000. 77 Jürgens, Carsten 5 RESULTS The model runs indicated that the land-use changes from 1987 to 1993 resulted in slightly higher runoff peaks. This is probably due to the increased sealed surfaces in 1993 due to increased building construction. Further scenarios investigated continued suburbanisation. One wanted to know how much sealed surface the catchment can handle and, whether or not, the spatial arrangement has an effect upon the river discharge. In the Wenzenbach catchment for instance, about 6% of the area could be sealed without clear negative effect upon the runoff behavior. A disperse arrangement of new developments across the catchment is the best solution. Any concentration of buildings shows higher peak discharges than the disperse arrangement (Jürgens, 1999a,b). 6 CONCLUSION In this study remote sensing demonstrates its ability to exactly locate and quantify different land-uses/land-covers as well as sealed surfaces, which cannot be obtained from official statistics due to problems with nomenclature and a lacking link to a specific site. Both informations are essential for such a hydrologic study. Therefore remote sensing has proven ist usefulness. Besides the areal quantification of land-use changes it is possible to quantify their effect upon river discharge during single rain storms by application of a hydrological model. The simulation studies offer the possibility to give advice to planners for the location and extent of future developments as such that they do not affect storm runoff negatively with higher peak discharges. REFERENCES Beaseley, D.B. & Huggins, L.F., 1991. ANSWERS (Areal Nonpoint Source Watershed Environment Response Simulation) User´s Manual.- University of Georgia, Coastal Plain Experiment Station, Agricultural Engeneering Department, Publication No. 5 Jürgens, C., 1999a. Vergleichende flächendetaillierte Einzugsgebietsmodellierung zum Hochwasser-Verhalten mesoskaliger Einzugsgebiete aufgrund erosiver Niederschläge.- Habilitationsschrift, Philosophische Fakultät III, Universität Regensburg Jürgens, C., 1999b. Anwendung des hydrologischen Einzugsgebietsmodells "ANSWERS" unter Einbeziehung von Fernerkundungs- und GIS-Techniken zur Analyse des Effektes von Landnutzungsveränderungen auf das Abflußverhalten.-In: Strobl, J. & Blaschke, T. (Hrsg.): Angewandte Geographische Informationsverarbeitung XI. Beiträge zum AGIT-Symposium Salzburg 1999. Heidelberg, pp. 298-303 Jürgens, C., 2000a. Change Detection - Erfahrungen bei der vergleichenden multitemporalen Satellitenbildauswertung in Mitteleuropa.-Photogrammetrie, Fernerkundung, Geoinformation (PFG), Heft 1/2000, pp. 5-18 Jürgens, C., 2000b. Application of a Hydrologic Model with Integration of Remote Sensing and GIS-Techniques for the Analysis of Land Use Change effects upon River Discharge.- IAHS-Red Book "Remote Sensing and Hydrology 2000", (in print) (=IAHS Publication 267) 78 International Archives of Photogrammetry and Remote Sensing. Vol. XXXIII, Supplement B7. Amsterdam 2000.
