Methods to Supplement Insufficient Ground Survey ... for Land Cover Classification Mr. Tamio
advertisement
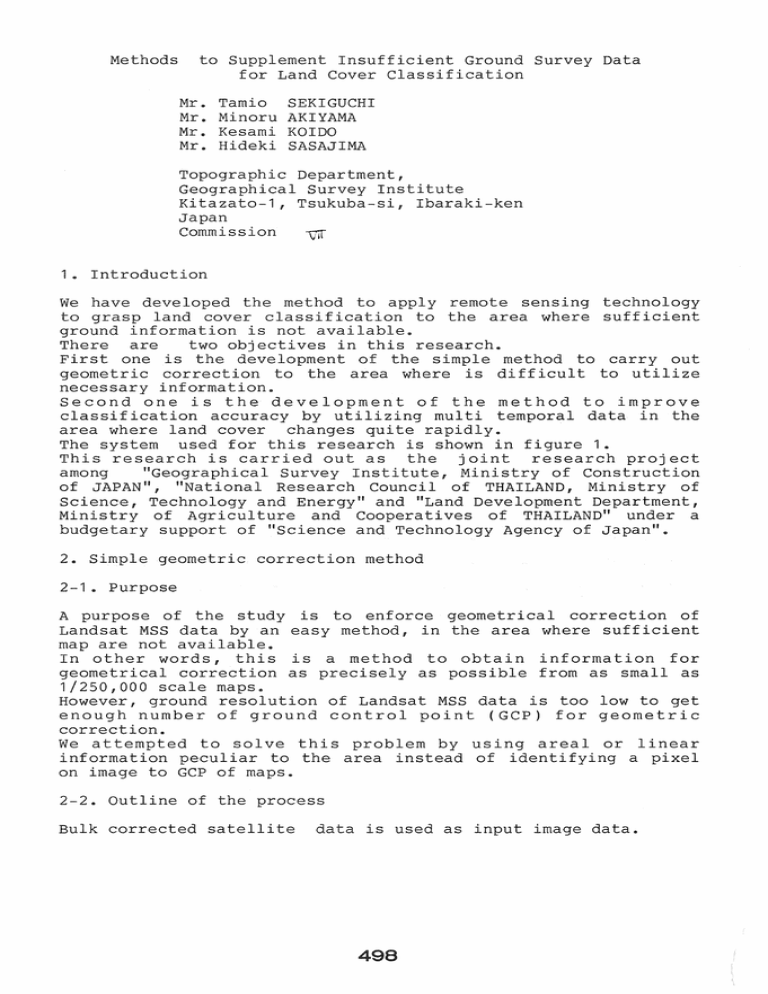
Methods
to Supplement Insufficient Ground Survey Data
for Land Cover Classification
Mr.
Mr.
Mr.
Mr.
Tamio
Minoru
Kesami
Hideki
SEKIGUCHI
AKIYAMA
KOIDO
SASAJIMA
Topographic Department,
Geographical Survey Institute
Kitazato-1, Tsukuba-si, Ibaraki-ken
Japan
Commission
V1f
1 .. Introduction
We have developed the method to apply remote sensing technology
to grasp land cover classification to the area where sufficient
ground information is not available.
There are
two objectives in this research.
First one is the development of the simple method to carry out
geometric correction to the area where is difficult to utilize
necessary information.
Second one is the development of the method to improve
classification accuracy by utilizing multi temporal data in the
area where land cover changes quite rapidly.
The system used for this research is shown in figure 1.
This research is carried out as the joint research project
among
"Geographical Survey Institute, Ministry of Construction
of JAPAN", "National Research Council of THAILAND, Ministry of
Science, Technology and Energy" and "Land Development Department,
Ministry of Agriculture and Cooperatives of THAILAND" under a
budgetary support of "Science and Technology Agency of Japan" ..
2. Simple geometric correction method
2-1 .. Purpose
A purpose of the study is to enforce geometrical correction of
Landsat MSS data by an easy method, in the area where sufficient
map are not available.
In other words, this is a method to obtain information for
geometrical correction as precisely as possible from as small as
1/250,000 scale maps.
However, ground resolution of Landsat MSS data is too low to get
enough number of ground control point (GCP) for geometric
correction.
We attempted to solve this problem by using areal or linear
information peculiar to the area instead of identifying a pixel
on image to GCP of maps.
2-2. Outline of the process
Bulk corrected satellite
data is used as input image data.
498
PROCESSING UNIT
DATA GENERAL
ECLIPSE MV/800011
CHARACTER
DISPLAY
TERMINAL
o
~\'------l
J>
_ _ _-I
ARRA Y PROCESSOR
FPS-5205
LINE PR INTER
250 l/min
n
:x:
SYSTEM MASTER CONSOLE
J>
z
z
rn
,...
o
n
:x:
THREE CHARACTER
DISPLAY TERMINALS
MAGNETIC D[SK SUBSYSTEM
354 MB X 3 DRIVES
....
0N
I------... ~
"'I,i
MAGNETIC TAPE SUBSYSTEM
9 TRACKS 1600/6250 BPI
2 DRIVES
"
fI
Figure 1
Figure 2
DIGITIZER
MUTOH 10
IMAGE DISPLAY
NEXUS 6.100
~~~
IMAGE MEMORY 1 MB
~
512 X 480 PIXELS
DIG lTIZER
Hardware System Configuration.
Locality map for these studies in Thailand.
Scale is 1:1,400,000 ..
conventional geometric correction is carried out by using GCP of
four to five points during one scene as pre-processing.
Map is digitized in raster data with a scanner where resampling
pixel size is as same pixel size as pre-processed image data.
The map raster data and image data are overlapped on color
display with different color.
Image plane is moved manually while paying attention to the area
or line object of map plane, so that both data can be fitted.
In the mean time, the quanti ty of motion of image plane is
measured which corresponds to the residuals of pre-processing at
the center of each area. This process is repeated by an area of
500 - 1000 pixel square to cover the whole area.
Final geometrical correction is carried out with linear
transformation by using measured residuals of four points
enclosing the point being corrected.
Finally, whole output image are obtained by mosaicing all the
blocks corrected independently.
2-3.. Case study
Test site is an area including Bangkok city of central Thailand
ranging 100km east and west by 100km north and south (figure 2).
Landsat MSS data received in Thailand was used as input image
data (table 1) ..
The map is 1/250,000 scale map of Thailand (table 2).
As for pre-processing, geometric correction was carried out by
using four GCP points. It is re-sampled in accordance with UTM
projection by using linear transformation into SOm pixel size.
1/250,000 maps were digitized to raster data with a scanner.
The sampling pitch of a scanner is 0.2mm quantized in 256 levels
with red channel which is most clear and useful among four
channels ( R, G, Band B/W ) ..
Map raster data was resampled in SOm by linear transformation
into UTM projection. Four sheets of resampled data were gathered
into one plane.
The displacement quantity of image data plane to map plane were
measured in 16 blocks by dividing whole test area.
The displacement quantities of image plane to a map plane are
shown in figure 3. And the geometric correction was made by using
them.
The remainder difference at the verification points after
geometric correction are shown in figure 4.
2-4. Conclusion
It became clear that this simple geometric correction method
using small scale map has enough accuracy_
Besides, it is applicable to register multiple image data which
are, in fact, used in the second study of this report.
3.
Classification method using multi temporal data
3-1. Purpose
It is difficult to carry out a
500
land use condition survey to
14° 42' N
100° 0'7' E
I
\
\
\
\
J
\
~
\
\
\
(
\
)
25km
Figure 3
\
~
: 5 pixels
13° 48' N
101
0
01' E
Distributions of GCPs and quantity of motion.
501
14
100
0
0
42' N
07' E
t
o
I
I
()
/
(
)
25km
Figure 4
t--- :
5 pixels
13
0
48' N
101
0
01' E
The remainder difference at the verification points
after geometric correction.
502
tropical country by using artificial satellite data of one time.
In this regard, a method to improve classification accuracy by
using multi temporal artificial satellite data and a specialty
knowledge of researchers was developed.
3-2. Outline of process
First of all, all data were geometrically corrected and
registered to each other by using the method described above.
Next, a classification is carried out independently by Maximum
Likelihood Method. The result is filed in BIP format.
Extracting one category from each classification result and
overlayed on color display.
Considering one category of single date data , each pixel should
be classified in two cases whether it is of the category or not.
In other words, there are square of n cases as for n date data.
Accordingly, each pixel is belonged to any of square of n cases.
Each different case is indicated on a color display with
different
color
so that researcher can extract optimal
combination of cases interactively out of all cases.
Final classification is carried out by repeating the
aforementioned processing for every categories.
Of course the pixel fixed by the former turns were omitted from
the pixels being classified in the next processing turn.
After finishing all the turns, there is still possibility of
remaining un-classified pixels.
Those un-classified pixels were classified by using the majority
vote method along time axis which counts the classification
result of four
date data or the majority vote method over
spacial axes which counts adjacent eight pixels around the pixel.
3-3.. Case study
Test site is KANCHANA-BURI area ( ranging 26km east and west by
24km north and south) about 130km west of Bangkok city of
Thailand (figure 2).
Major land use of this area is paddy field, sugarcane and
orchard.
It is in wide variety of terrain as flat ground,
plateau and a low mountainous region.
Four seasons of Landsat MSS data received at Thai receiving
station were used (table 3).
Test area were extracted from each of the four date data and
geometrically corrected.
Then all data were classified independently into nine categories
by Maximum Likelihood Method.
A part of the classification result is shown in figure 5 and
figure 6 ..
Then, one category was chosen to be displayed for interactive
decision making process.
In this case, since four date data were used, there were 16 cases
of combination displayed in 16 colors.
The order of categories to be processed were decided as easy to
interpret by visual as water surface,
paddy field, town , sugar
cane, bamboo, ballen land, forest land and shade.
In other words it is the order that high classification accuracy
503
Legend
:!:!:!::::! Town
•
Paddy field
Suger cane
•
Forest land
Bamboo
•
Water surface
Barren land
Clouds
Shade
Unclassified
Figure 5
Land Cover Classification of KANCHANA-BURI.
Scale is 1:100,000.
Base data: 14 January 1987 Landsat-5 MSS.
Legend
::::::::::: Town
It'Ct:lltcd:«:.d::*'
•
Paddy field
:~~~~~~~~~~
S uger cane
1000000000('
Forest land
Bamboo
0'1
•
o
01
Water surface
Barren land
Clouds
•
Shade
::::::::::: 'Un cIa s s i fie d
Figure 6
Land Cover Classification of KANCHANA-BURI.
Scale is 1 :100,000.
Base data: 26 September 1984 Landsat-4 MSS.
Legend
::!::::!!::
Town
•
Paddy field
Suger cane
Forest land
Bamboo
•
Water surface
Barren land
Clouds
•
Shade
Unclassified
Figure 7
Result of Land Cover Classification.
Scale is 1 :100,000.
can be expected. After processed all categories, unclassified
pixels were processed.
A part of the final classification result is shown in figure 7 ..
3-4 .. Conclusion
We think that the classification result was improved in
comparison with each of the
single date classification,
an
accuracy estimation has not finished yet though.
We will further improve this method by adding a capability to
utilize soil condition maps, terrain elevation data and so on.
This method can take account of the knowledge of a researcher and
improve classification accuracy.
4 .. Acknowledgment
We wish to express our gratitude to researchers of Land
Development Department (LDD) Ministry of Agriculture and
researchers of National Research Council of THAILAND (NRCT) for
their great cooperation to this study through the joint research
project. Special thanks to Mr. Suvit Vibulsresth, Mr. Manu
Omakupt, Mr. Anusorn Chantanaroj, Mr. Paisal Impat.
table 1
Satellite
satellite
sensor
Landsat-5
table 2
data parameter of case study.
MSS
path-row
date
129-50
85,,2 .. 2
level
BULK
format
CCRS
Map data of test site.
scale
number
name of map
"""'--------CHANGWAT SUPHAN BURl
CHANGWAT PHRA NAKHON SI AYUTTHAYA
CHANGWAT NAKHON PATHOM
BANGKOK METROPOLIS
....
1/250,000
1/250,000
1/250,000
1/250,000
table 3
ND47-07
ND47-08
ND47 -11
ND47-12
Satellite data of test site.
----
-
,~.
Satellite
sensor
path -row
-'*~--.-
Landsat
Landsat
Landsat
Landsat
4
4
5
5
MSS
MSS
MSS
MSS
1 3 0-50
1 3 0-50
1 3 0-50
13 0-50
--.-
"-_.
date
level
format
f----
84 .. 5 " 5.
84 .. 9.26.
85.12.10.
87. 1 .. 1 4.
Bulk
Bulk
Bulk
Bulk
CCRS
CCRS
CCRS
CCRS


