Document 11827378
advertisement
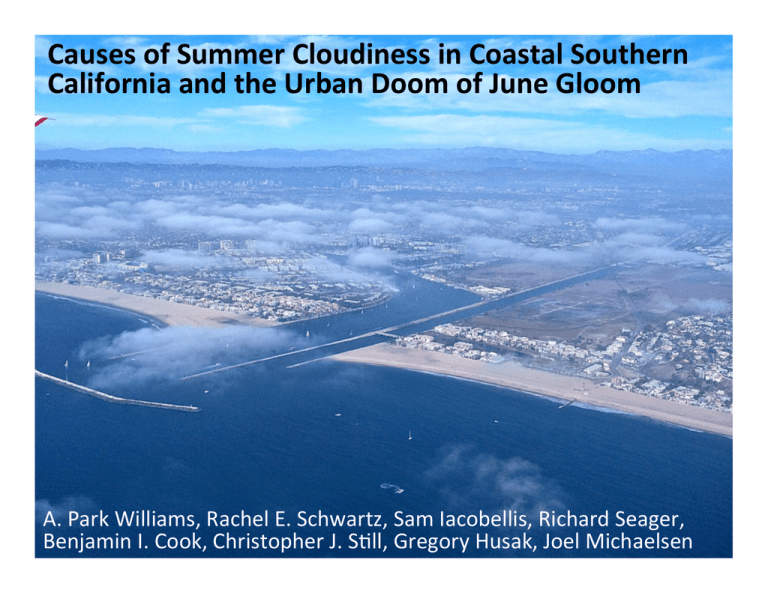
Causes of Summer Cloudiness in Coastal Southern California and the Urban Doom of June Gloom A. Park Williams, Rachel E. Schwartz, Sam Iacobellis, Richard Seager, Benjamin I. Cook, Christopher J. SBll, Gregory Husak, Joel Michaelsen Stratus clouds regulate drought Effect of stratus on mean daily surface condi:ons: May-­‐Sep 2007-­‐2014 1000 Solar clear 800 Radia:on stratus 600 ~50% 400 reducBon 200 0 6:00 12:00 18:00 10 Vapor pressure 8 deficit 6 ~55% 4 reducBon 2 0 6:00 12:00 18:00 Time of day hPa W m-­‐2 Santa Barbara Airport Introduc:on 2 Weather sta)on data from www.geog.ucsb.edu/ideas Summer fog provides much-­‐needed water to ecosystems Doug Fischer AP Williams What will happen to stratus clouds in the future? Specific Ques:ons to be answered: Can we use exis:ng observa:onal data to … 1) diagnose MULTI-­‐DECADE TRENDS in stratus frequency? 2) diagnose causes of INTERANNUAL VARIABILITY in stratus frequency? 4 Hourly cloud-­‐base height data from 24 airfields Methods Santa Barbara Los Angeles -­‐ Summer stratus season: May-­‐Sep -­‐ Hourly cloud-­‐base heights from 24 airfields Islands San Diego -­‐ Stratus clouds: any cloud with cloud base <1000 m -­‐ Considered only hours 07:00, 10:00, 13:00, 16:00 -­‐ Only consider staBons with ≥40 years of valid data since 1960 * Cloud height data from NCDC: <p.ncdc.noaa.gov/pub/data/noaa/ -­‐ FOG: lowest 25% of stratus clouds at a given airfield 5 The Lowest 25% of Stratus Clouds in the Ci:es are OZen Fog in the Coastal Mountains Los Angeles From SRTM data hCp://spaceplace.nasa.gov/topomap-­‐earth/en/ 6 Trends in Summer Stratus Frequency Santa Barbara Los Angeles Islands San Diego frequency 0.8 May-­‐Sep stratus frequency 1948-­‐2014 0.6 0.4 0.2 1950 1960 1970 1980 1990 2000 2010 year Trends Interannual Variability Conclusions 7 Trends in Summer Stratus Frequency From Schwartz et al. (2014, GRL) Stratus Frequency Slight nega:ve trend a^ributed to slight posi:ve trend in PDO High West Coast Stratus Frequency Correla:on with SST 1 0 Low -­‐1 1950 1960 Trends 1970 1980 Year 1990 2000 Interannual Variability 2010 Conclusions 8 Trends in Summer Stratus Frequency From LaDochy and Wi:w (2012, Pure Appl. Geophys.) Hours of low visibility per year Large reduc:on in ground-­‐level fog in Los Angeles Year Trends Interannual Variability Conclusions 9 Rising Stratus Cloud Base Heights 25 20 15 10 5 0 -­‐5 25 20 15 10 5 0 -­‐5 Los Angeles Islands San Diego * ≥95% significance ** ≥99% significance * * * * * * * * * * * * * 7AM ONLY * * * * ** * * * * ** * * * * * * * * SBA OXR NTD VNY SMO LAX BUR HHR TOA LGB SLI FUL SNA ONT NFG CLD NZY SAN NKX MYF NRS SEE NSI NUC Δ Base Height Δ Base Height (m / decade) (m / decade) Santa Barbara Airfield Trends Interannual Variability Conclusions 10 Stratus Frequency Time Series for 7:00 AM Frequency 0.5 Los Angeles Fog (lowest 25%) Upper 75% stratus 42% increase 0.4 0.3 0.2 0.1 64% reduc:on 1950 1960 1970 1980 1990 2000 2010 Frequency San Diego 0.6 0.5 0.4 0.3 0.2 0.1 6% increase 26% reduc:on 1950 1960 1970 1980 1990 2000 2010 Trends Interannual Variability Conclusions 11 Trends are strongest at night and early morning Δ Stratus Frequency since 1948 Stratus Frequency Trends by Hour 0.10 0.05 0 -­‐0.05 -­‐0.10 -­‐0.15 Los Angeles Interna:onal Airport (LAX) Fog Upper 75% stratus 01:00 04:00 07:00 10:00 13:00 16:00 19:00 22:00 solid bars: San Diego Lindbergh Field (SAN) 0.10 0.05 0 -­‐0.05 -­‐0.10 -­‐0.15 01:00 04:00 07:00 10:00 13:00 16:00 19:00 22:00 significant with ≥95% confidence Hour Trends Interannual Variability Conclusions 12 Inversion top Al:tude Al:tude Why Have Cloud Base Heights Risen? Inversion base cloud base Dew p Dew p oint oint Dew Point Air T Temperature Trends Surface warming Dew Point Air T Temperature Interannual Variability Conclusions 13 Nighlme Warming = Rising Cloud Base 7AM ΔBase Height vs Warming r = 0.83 P<0.001 20 Δ Fog Frequency (% / decade) Δ Base Height (m / decade) 25 7AM ΔFog vs Warming 15 Dots: 10 individual airfields 5 r = -­‐0.89 P<<0.001 5 0 -­‐5 -­‐10 0 -­‐5 0.1 0.2 0.3 0.4 0.5 -­‐15 0.1 ΔTmin (°C / decade) Trends Interannual Variability 0.2 0.3 0.4 0.5 ΔTmin (°C / decade) Conclusions 14 Urbaniza:on as a driver of nighlme warming ΔUrban = 2011 Urban – 1950 Urban 2011 Na)onal Land Cover Dataset Trends Interannual Variability Based on 1950 US Census Data -­‐ Hammer et al. (2004, Landscape & Urban Planning) -­‐ Syphard et al. (2011, J Env Manag) Conclusions 15 Urbaniza:on as a driver of warming ΔTmin Warming vs Urbaniza:on 0.4 r = 0.78 P<0.005 0.5 Δ Tmax (°C / decade) Δ Tmin (°C / decade) 0.5 ΔTmax Warming vs Urbaniza:on 0.4 0.3 r = -­‐0.10 P=0.46 0.3 0.2 0.2 Dots: individual airfields 0.1 0 0.2 0.4 0.6 0.8 0.1 0 ΔUrban (frac:on) Trends Interannual Variability 0.2 0.4 0.6 0.8 ΔUrban (frac:on) Conclusions 16 Urbaniza:on as a driver of cloud-­‐base liZing 7AM ΔBase Height vs Urbaniza:on r = 0.68 P<0.01 20 Δ Fog Frequency (% / decade) Δ Base Height (m / decade) 25 7AM ΔFog vs Urbaniza:on 15 10 5 r = -­‐0.70 P<0.005 5 0 -­‐5 -­‐10 0 -­‐5 0 -­‐15 0.2 0.4 0.6 0.8 0 ΔUrban (frac:on) Trends Interannual Variability 0.2 0.4 0.6 0.8 ΔUrban (frac:on) Conclusions 17 What will happen to stratus clouds in the future? Specific Ques:ons to be answered: Can we use exis:ng observa:onal data to … 1) diagnose MULTI-­‐DECADE TRENDS in stratus frequency? 2) diagnose causes of INTERANNUAL VARIABILITY in stratus frequency? Trends Interannual Variability Conclusions 18 Strong Interannual Agreement Across the Region z-­‐score (σ from mean) 3 De-­‐trended, standardized records of stratus frequency 2 SB LA SD Average 1 0 -­‐1 -­‐2 -­‐3 1950 Trends 1960 1970 1980 year 1990 Interannual Variability 2000 2010 Conclusions 19 Strong Differen:a:on Between Low and High Stratus Cloud Records z-­‐score (σ from mean) 3 De-­‐trended, standardized records of stratus frequency by height class Lowest 75% Highest 25% 2 1 0 -­‐1 -­‐2 -­‐3 1950 Trends 1960 1970 1980 year 1990 Interannual Variability 2000 2010 Conclusions 20 Low and High Stratus Promoted by Different Characteris:cs of the Temperature Inversion From Iacobellis and Cayan (2013, JGR), we know: Low stratus promoted by a STRONG inversion layer May 19, 2010 Trends High stratus promoted by a HIGH inversion layer May 22, 2014 Interannual Variability Conclusions 21 Low and High Stratus Promoted by Different Characteris:cs of the Temperature Inversion Mean T profile at San Diego 1960-­‐2014 Al:tude (km) 5 4 3 2 1 0 Sea level Trends Inversion Strength Inversion Top Inversion Base 0 10 T (°C) 20 Interannual Variability Conclusions 22 Low and high stratus clouds are promoted by different climate processes Interannual variability in stratus frequency versus temperature inversion metrics at San Diego Low stratus promoted by a STRONG inversion layer r = 0.78 P<<0.001 1 0 -­‐1 -­‐2 5 6 7 8 Mean inversion strength (°C) Trends 2 (z-­‐score) High Stratus Frequency 2 (z-­‐score) Low Stratus Frequency 3 High stratus promoted by a HIGH inversion layer r = 0.82 P<<0.001 1 0 -­‐1 -­‐2 0.1 0.2 0.3 Frac:on of days with inversion base >800 m Interannual Variability Conclusions 23 Low and high stratus clouds are promoted by different climate processes Correla:on with reanalysis climate: 1979–2014 Coastal upwelling promotes stability above marine layer High stratus promoted by synop:c frontal systems Low Stratus VS near-­‐surface T & wind (surface – 950 hPa T & wind) High Stratus VS upper-­‐level T & wind (500-­‐200 hPa T & wind) -­‐0.8 -­‐0.4 0.4 correla:on (r) *Only correla)ons with P < 0.05 shown Trends 0 0.8 Climate fields from NASA’s MERRA Reanalysis Interannual Variability Conclusions 24 Conclusions What does all this mean for the future? Trends Interannual Variability Conclusions 25 How will the relevant climate variables change in the future? How summer frontal ac:vity change? Global climate models suggest decreased frequency (Seager et al. 2014, J Clim) -­‐0.8 -­‐0.4 0.4 correla:on (r) *Only correla)ons with P < 0.05 shown Trends 0 0.8 Climate fields from NASA’s MERRA Reanalysis Interannual Variability Conclusions 26 How will the relevant climate variables change in the future? How will stability above the marine layer change? Global climate models suggest increased upwelling (Wang et al. 2015, Nature) -­‐0.8 -­‐0.4 0.4 correla:on (r) *Only correla)ons with P < 0.05 shown Trends 0 0.8 Climate fields from NASA’s MERRA Reanalysis Interannual Variability Conclusions 27 Stability Above the Marine Layer is Projected to Con:nue Increasing CMIP5 Climate Projec:ons through AD 2100 Lower troposphere stability Stronger T inversion PotenBal T @ 850 hPa minus T @ 2m Trends Interannual Variability Conclusions 28 Stability Above the Marine Layer has Increased 22 Temperature at 850 hPa (from radiosonde) San Diego Pt. Mugu San Nicolas Island 20 °C 18 Warming 16 1960 20 °C 1970 1980 1990 2000 2010 Sea Surface Temperature NOAA Ext. NCEP/NCAR ECMWF 18 16 Not Warming 1950 Trends 1960 1970 1980 1990 2000 Interannual Variability 2010 Conclusions 29 Low stratus rela:onship with large-­‐scale climate is complicated CMIP5 Climate Projec:ons through AD 2100 Lower troposphere stability Stronger T inversion PotenBal T @ 850 hPa minus T @ 2m Subsidence @ 700 hPa Specific humidity @ 700 hPa Trends Interannual Variability No strong trend. Tendency toward more subsidence Less radiaBve cooling by cloud layer Conclusions 30 Al:tude Al:tude Can the night and early morning cloud-­‐base height affect the day:me? Air T Dew-­‐Point Depression Trends More Surface warming oint oint Dew p Dew p Dew Point Surface warming Dew Point Air T Dew-­‐Point Depression Interannual Variability Conclusions 31 Al:tude Al:tude Can the night and early morning cloud-­‐base height affect the day:me? Air T Dew-­‐Point Depression Trends More Surface warming oint oint Dew p Dew p Dew Point Surface warming Dew Point Air T Dew-­‐Point Depression Interannual Variability Conclusions 32 Conclusions • Urban warming rising clouds less fog • Increased stability above the marine layer unlikely to compensate for urban effects • PosiBve feedback: decreased cloudiness more sunlight • Feedback may have been stalled in last decade due to cold SSTS Trends Interannual Variability Conclusions 33

