JOINT VARIABILITY OF GLOBAL RUNOFF AND SEA-SURFACE TEMPERATURES Abstract Principal Components Analysis
advertisement

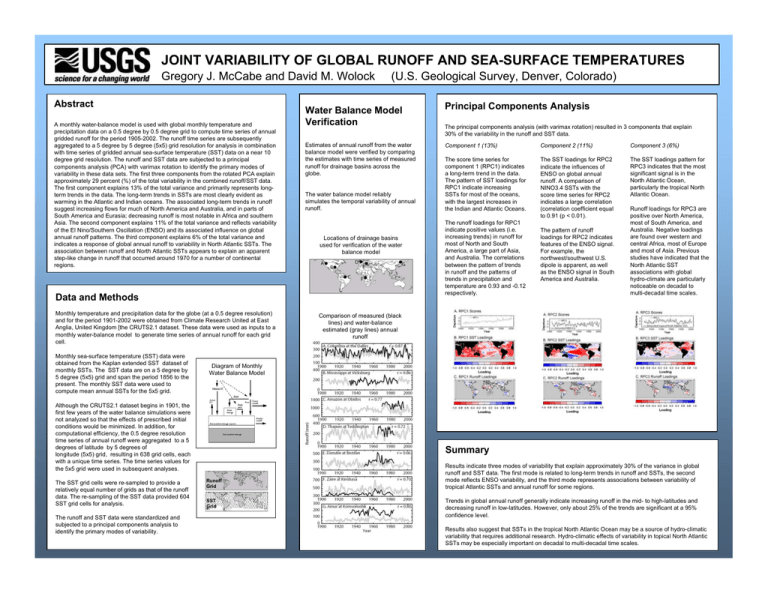
JOINT VARIABILITY OF GLOBAL RUNOFF AND SEA-SURFACE TEMPERATURES Gregory J. McCabe and David M. Wolock Abstract A monthly water-balance model is used with global monthly temperature and precipitation data on a 0.5 degree by 0.5 degree grid to compute time series of annual gridded runoff for the period 1905-2002. The runoff time series are subsequently aggregated to a 5 degree by 5 degree (5x5) grid resolution for analysis in combination with time series of gridded annual sea-surface temperature (SST) data on a near 10 degree grid resolution. The runoff and SST data are subjected to a principal components analysis (PCA) with varimax rotation to identify the primary modes of variability in these data sets. The first three components from the rotated PCA explain approximately 29 percent (%) of the total variability in the combined runoff/SST data. The first component explains 13% of the total variance and primarily represents longterm trends in the data. The long-term trends in SSTs are most clearly evident as warming in the Atlantic and Indian oceans. The associated long-term trends in runoff suggest increasing flows for much of North America and Australia, and in parts of South America and Eurasia; decreasing runoff is most notable in Africa and southern Asia. The second component explains 11% of the total variance and reflects variability of the El Nino/Southern Oscillation (ENSO) and its associated influence on global annual runoff patterns. The third component explains 6% of the total variance and indicates a response of global annual runoff to variability in North Atlantic SSTs. The association between runoff and North Atlantic SSTs appears to explain an apparent step-like change in runoff that occurred around 1970 for a number of continental regions. (U.S. Geological Survey, Denver, Colorado) Water Balance Model Verification Estimates of annual runoff from the water balance model were verified by comparing the estimates with time series of measured runoff for drainage basins across the globe. The water balance model reliably simulates the temporal variability of annual runoff. Locations of drainage basins used for verification of the water balance model Data and Methods Monthly temperature and precipitation data for the globe (at a 0.5 degree resolution) and for the period 1901-2002 were obtained from Climate Research United at East Anglia, United Kingdom [the CRUTS2.1 dataset. These data were used as inputs to a monthly water-balance model to generate time series of annual runoff for each grid cell. Monthly sea-surface temperature (SST) data were obtained from the Kaplan extended SST dataset of monthly SSTs. The SST data are on a 5 degree by 5 degree (5x5) grid and span the period 1856 to the present. The monthly SST data were used to compute mean annual SSTs for the 5x5 grid. The runoff and SST data were standardized and subjected to a principal components analysis to identify the primary modes of variability. The principal components analysis (with varimax rotation) resulted in 3 components that explain 30% of the variability in the runoff and SST data. Component 1 (13%) Component 2 (11%) Component 3 (6%) The score time series for component 1 (RPC1) indicates a long-term trend in the data. The pattern of SST loadings for RPC1 indicate increasing SSTs for most of the oceans, with the largest increases in the Indian and Atlantic Oceans. The SST loadings for RPC2 indicate the influences of ENSO on global annual runoff. A comparison of NINO3.4 SSTs with the score time series for RPC2 indicates a large correlation (correlation coefficient equal to 0.91 (p < 0.01). The SST loadings pattern for RPC3 indicates that the most significant signal is in the North Atlantic Ocean, particularly the tropical North Atlantic Ocean. The runoff loadings for RPC1 indicate positive values (i.e. increasing trends) in runoff for most of North and South America, a large part of Asia, and Australia. The correlations between the pattern of trends in runoff and the patterns of trends in precipitation and temperature are 0.93 and -0.12 respectively. The pattern of runoff loadings for RPC2 indicates features of the ENSO signal. For example, the northwest/southwest U.S. dipole is apparent, as well as the ENSO signal in South America and Australia. Runoff loadings for RPC3 are positive over North America, most of South America, and Australia. Negative loadings are found over western and central Africa, most of Europe and most of Asia. Previous studies have indicated that the North Atlantic SST associations with global hydro-climate are particularly noticeable on decadal to multi-decadal time scales. Comparison of measured (black lines) and water-balance estimated (gray lines) annual runoff Diagram of Monthly Water Balance Model Although the CRUTS2.1 dataset begins in 1901, the first few years of the water balance simulations were not analyzed so that the effects of prescribed initial conditions would be minimized. In addition, for computational efficiency, the 0.5 degree resolution time series of annual runoff were aggregated to a 5 degrees of latitude by 5 degrees of longitude (5x5) grid, resulting in 638 grid cells, each with a unique time series. The time series values for the 5x5 grid were used in subsequent analyses. The SST grid cells were re-sampled to provide a relatively equal number of grids as that of the runoff data. The re-sampling of the SST data provided 604 SST grid cells for analysis. Principal Components Analysis Summary Runoff Grid SST Grid B. Results indicate three modes of variability that explain approximately 30% of the variance in global runoff and SST data. The first mode is related to long-term trends in runoff and SSTs, the second mode reflects ENSO variability, and the third mode represents associations between variability of tropical Atlantic SSTs and annual runoff for some regions. Trends in global annual runoff generally indicate increasing runoff in the mid- to high-latitudes and decreasing runoff in low-latitudes. However, only about 25% of the trends are significant at a 95% confidence level. Results also suggest that SSTs in the tropical North Atlantic Ocean may be a source of hydro-climatic variability that requires additional research. Hydro-climatic effects of variability in topical North Atlantic SSTs may be especially important on decadal to multi-decadal time scales.


