SIR-C GROUND DATA SYSTEM AND ... C.Y. Chang and J.C. Curlander
advertisement
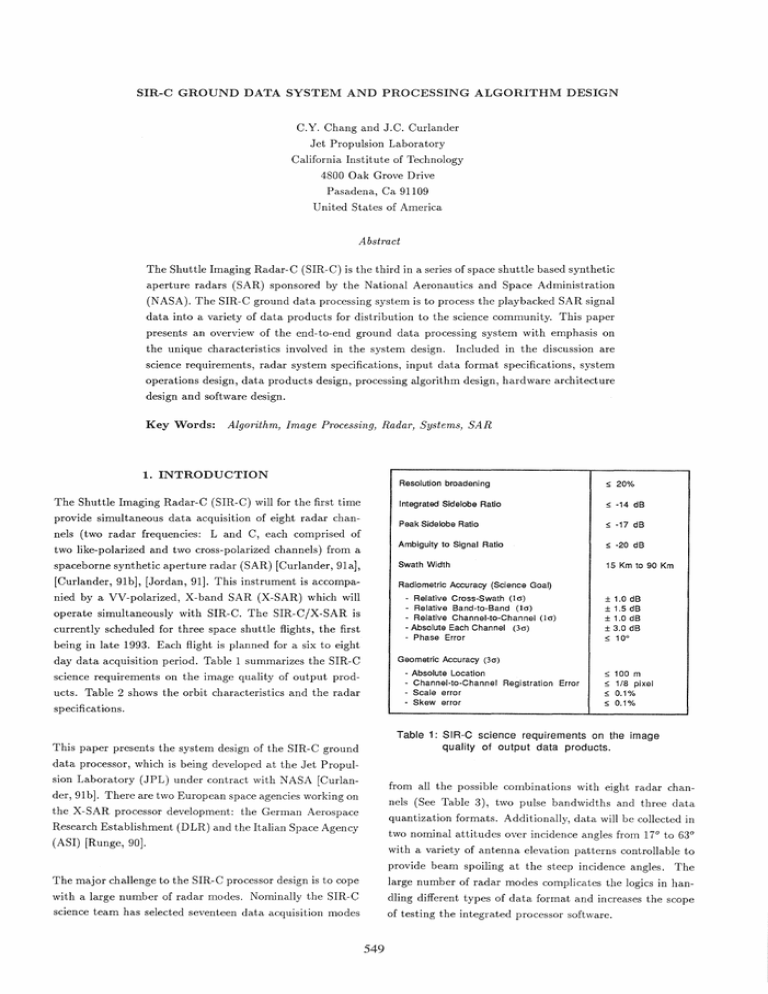
SIR-C GROUND DATA SYSTEM AND PROCESSING ALGORITHM DESIGN C.Y. Chang and J.C. Curlander Jet Propulsion Laboratory California Institute of Technology 4800 Oak Grove Drive Pasadena, Ca 91109 United States of America Abstract The Shuttle Imaging Radar-C (SIR-C) is the third in a series of space shuttle based synthetic aperture radars (SAR) sponsored by the National Aeronautics and Space Administration (NASA). The SIR-C ground data processing system is to process the playbacked SAR signal data into a variety of data products for distribution to the science community. This paper presents an overview of the end-to-end ground data processing system with emphasis on the unique characteristics involved in the system design. Included in the discussion are science requirements, radar system specifications, input data format specifications, system operations design, data products design, processing algorithm design, hardware architecture design and software design. Key Words: Algorithm, Image Processing, Radar, Systems, SAR 1. INTRODUCTION Resolution broadening ::; 20% Integrated Sidelobe Ratio ::; -14 dB Peak Side lobe Ratio ::; -17 dB Ambiguity to Signal Ratio ::; -20 dB spaceborne synthetic aperture radar (SAR) [Curlander, 91a]' Swath Width 15 Km to 90 Km [Curlander, 91b], [Jordan, 91]. This instrument is accompa- Radiometric Accuracy (Science Goal) The Shuttle Imaging Radar-C (SIR-C) will for the first time provide simultaneous data acquisition of eight radar channels (two radar frequencies: Land C, each comprised of two like-polarized and two cross-polarized channels) from a nied by a VV-polarized, X-band SAR (X-SAR) which will - Relative Cross-Swath (10") - Relative Band-to-Band (10") - Relative Channel-to-Channel (10") - Absolute Each Channel (30-) - Phase Error operate simultaneously with SIR-C. The SIR-CjX-SAR is currently scheduled for three space shuttle flights, the first being in late 1993. Each flight is planned for a six to eight ± 1.0 dB ± 1.5 dB ± 1.0 dB ± 3.0 dB ::; 10° Geometric Accuracy (30") day data acquisition period. Table 1 summarizes the SIR-C - science requirements on the image quality of output products. Table 2 shows the orbit characteristics and the radar specifications. Absolute Location Channel-to-Channel Registration Error Scale error Skew error ::; ::; ::; ::; 100 m 1/8 pixel 0.1% 0.1% Table 1: SIR-C science requirements on the image quality of output data products. This paper presents the system design of the SIR-C ground data processor, which is being developed at the Jet Propulsion Laboratory (JPL) under contract with NASA [Curlan- from all the possible combinations with eight radar chan- der,91b]. There are two European space agencies working on nels (See Table 3), two pulse bandwidths and three data the X-SAR processor development: the German Aerospace quantization formats. Additionally, data will be collected in Research Establishment (DLR) and the Italian Space Agency two nominal attitudes over incidence angles from 17° to 63° (ASI) [Runge, 90]. with a variety of antenna elevation patterns controllable to provide beam spoiling at the steep incidence angles. The The major challenge to the SIR-C processor design is to cope large number of radar modes complicates the logics in han- with a large number of radar modes. Nominally the SIR-C dling different types of data format and increases the scope science team has selected seventeen data acquisition modes of testing the integrated processor software. 549 techniques (multiple PRF technique and attitude steering SAR Orbit technique, respectively) are required to resolve the problems 215 ± 25 Km - Nominal Altitude - Eccentricity - Inclination [Chang, 92a]' [Chang, 92b]. The high attitude drift rates induce fast Doppler drifts in both cross-track and along-track dimensions. Frequent Doppler update is required to main- Attitude Measurement Error(3cr) - Roll - Yaw - Pitch ±1.24° ±1.43° ±1.78° tain the image quality, which complicates the geometric rec- ±0.03°/sec ±0.03°/sec ±0.03°/sec The third challenge to the SIR-C processor design is to pro- tification procedure to produce a seamless image. Attitude Drift Rate Error (3cr) - Roll - Yaw - Pitch duce radiometrically calibrated and geometrically registered multi-band, polarimetric SAR image [Freeman, 89], [Klein, Transmitter frequency 1.25 GHz 5.30 GHz 92]. For radiometric calibration, the built-in-test-equipment Poiaiization HH, HV, VH, VV tenna, receive only noise data for estimating the noise power, Pulse bandwidth 20, 10 MHz calibration tone signal for monitoring the receiver gain and Pulse duration 33.8, 16.9, 8.44 usec - L-Band - C-Band (BITE) data are designed for probing the health of the an- temperature measurements and T /R module failure information transmitted via the downlink telemetry. These ancillary Sampling rate 45, 22.5 MHz Data quantization format 4-bit, 8-bit, (8,4) BFPQ Pulse Repetition Frequency 1344, 1395, 1440, 1488, 1512, 1620, 1674, 1736 Hz data and calibration site data are essential to derive radiometric calibration parameters which are applied during the data processing to produce calibrated image product. For geometric registration, special consideration is required in Antenna Dimension the processor design to ensure that the output images are 12.1 m x 2.8 m 12.1 mxO.74m - L-Band - C-Band registered in both cross-track and along-track dimensions. Incidence Angle The remaining paper presents an overview of the SIR-C endto-end ground data processing system design, which includes Table 2: SIR-C orbit characteristics and radar specifications. input data format specifications, system operations design, data products design, processing algorithm design, hardware I\it:IE CHANNEL-1 architecture design and software design. At the end of the CHANNEL-2 CHANNEL-3 CHANNEL-4 1 2 LHH LHH LHV LHV paper, we give a brief summary of the status and plan for LVH LVH 3 a+I CHH LVV CHV LVV CHV the processor development. 4 5 6 CVH LHH CVH CVV CVV LHH LVV LVV a+I CHH CVV LHH LHH CVV CVV CVV 2. INPUT DATA FORMAT 7 8 9 10 11 LHH LHH CHH CHH LVV LVH LVV LVH CVV CVH CVV CVH The signal data is recorded across four recorder channels on the High Density Digital Cassette (HDDC). The data rate LHH CHH CHV for each recorder channel is 45 Mbps for a total of 180 Mbps. LVH LHV LVV CVH CVV LHH LVV CHH CVV The signal data is quantized into one of three types of for- 12 13 14 LHH LVH LHV LVV 15 a+I CVH CHV CVV 16 LVH, LHH 23 Tape 1 Tape 2 LHH a+I LVV, LHV LVH CVH CVH,CHH LHV CHV mat: 4-bit, 8-bit or (8, 4) block floating point quantization (BFPQ). Nominally, the data is collected over a period called CVV,CHV data take using the same set of commanded radar parameters. The length of the data take varies from 3 minutes to as LVV CVV long as 15 minutes for ocean site data. The average length is estimated to be between 4 and 5 minutes. Table 3: SIR-C radar data aquisition modes. The nominal SIR-C data take consists of a turn-on sequence, The second challenge to the SIR-C processor design is to followed by the science data collection and a turn-off se- cope with the large attitude uncertainties and high attitude quence as shown in Figure 1. The first four seconds of the drift rates of the space shuttle platform as shown in Table turn-on sequence consist of (one second each): receive only 2. The large attitude uncertainties create PRF ambiguity noise data, caltone scan data, low noise amplifier (LN A) problem in Doppler centroid estimation and large Doppler er- BITE data and high power amplifier (HPA) BITE data. rors for data acquired over high terrain relief areas. Special These four second data are used for radiometric calibration. 550 Null-Lines at everyone second time tick time -------fl.~ Turn-On Sequence Turn-Off Sequence PRF FO\I CAL Scan LNA BITE or FO\I HPA BITE 0 r FO\I PRF A PRF PRF B B ....11------ 6 seconds ------11.111"' ""IIiI-.I--- Average 4.5 minutes - - - - t l..... ""IIiI.I----- 6 seconds ------II.~ Figure 1: SIR-C input data run format. Each segment in turn-on and turn-off sequence is 1 second duration. RON: Receive Only Noise, LNA: Low Noise Amplifier, HPA: High Power Amplifier, CAL scan: Caltone Scan. The remainder of the turn-on sequence consists of one sec- sites) will be processed into single-look, full-resolution com- ond of P RFA data and one second of P RFB data which plex imagery. These data will be analyzed to derive the together with the first second of P RFc data are used for parameters used for antenna pattern generation and polari- resolving PRF ambiguity in estimating the Doppler centroid metric calibration. These parameters will be applied during frequency [Chang, 92a]. The system remains on P RFc for the phase 2 standard processing to produce phase and am- collection of the science data. The turn-off sequence is simi- plitude calibrated data products [Freeman, 89], [Klein, 92]. lar to the turn-on sequence in that the science data collection is followed by one second each of P RFB and P RFA. The The system operations schedule is planned as follows. Six last four seconds of the turn-off sequence are receive only weeks are allocated for processor check-out upon receipt of the first signal data tape. noise data. Phase 1 operations will begin following the completion of the processor system check-out At everyone second time tick, a null-line is inserted. The and last for a period of twelve weeks. This is followed by null-line is obtained by setting a half of the phase array el- phase 2 operations for a period of forty weeks. ements with a 180 0 phase difference to create a null around 4. DATA PRODUCTS DESIGN the center of the antenna elevation pattern. The null-line is used to estimate the shuttle roll angle drift. The SIR-C output data products include three image prod- A sinusoid waveform, called the calibration tone (caltone) ucts: survey image, standard multi-look image and standard signal, is injected in the receiver electronics and recorded single-look image; and one reformatted signal data product. together with the return echo data. The caltone is used to The throughput requirements are to produce 24 survey im- estimate the receiver gain change as the temperature varies. age products per week during the phase 1 operations and to produce 9 standard multi-look image, 1 single-look image and 1 reformatted signal data products per week during the 3. SYSTEM OPERATIONS DESIGN phase 2 operations. The expected processor throughput far exceeds the requirements. Operations of the SIR-C processor is comprised of two main phases: phase 1 survey processing and phase 2 standard pro- The survey image is a 4-look, single-polarization strip image, cessing, which last for a total of one year. During the phase 1 stored in the byte amplitude format. The image is deskewed operations, a quick-look survey processor is employed to pro- to zero-Doppler and resampled to the ground range domain cess single-frequency band, single-polarization channel data with a 50 meter pixel spacing. The resolution is approxi- into low resolution strip images. These survey images will mately 100 meters. The length of the survey image is equal cover all the SIR-C ground sites albiet with a single radar to the length of the data take. The average length is approx- channel. By-products of the survey processor include un- imately 4.5 minutes or 2000 Km. The survey image will be ambiguous Doppler centroid estimates history and roll an- recorded on Alden thermal prints and CD-ROMs. The CD- gle estimates history. Additionally, during the phase 1 op- ROMs will be distributed to all the principal investigators erations, some selected data segments (covering calibration (PIs ). 551 Selected segment of data The standard multi-look image is a multiple look, polarimetric (single-, dual- or quad-polarization) frame image. The Null Lines Adjacent Lines Bursted Range Lines image is deskewed to zero- Doppler and resampled to the ground range domain with a 12.5 meter pixel spacing. The azimuth resolution is chosen to be 25 meters. The range resolution is chosen to be 25 meters or the natural resolution if greater than 25 meters. The image data is stored in a compressed cross-product format [Dubois, 89]. The basic frame size is chosen to be 100 Km. The image will be recorded on Kodak prints and CEOS formatted tapes. The standard single-look complex image is a single-look, polarimetric (single-, dual- or quad-polarization) frame image. The image is processed to full-resolution, deskewed to zeroDoppler and presented in the slant range domain in natural pixel spacing. The image data is stored in a compressed scattering matrix format. The basic frame size is chosen to be 50 Km. The image will be recorded on CEOS formatted tapes and a reduced, detected image will be printed by the Kodak printer. The reformatted signal data contains the signal data reformatted in the range line byte format. The signal data together with the decoded radar parameters will be stored on Survey Image CEOS formatted tapes. Figure 2: Survey processing algorithm flowchart. 5. PROCESSING ALGORITHM DESIGN collection at the start of each data take [Chang, 92a]. The 5.1 Survey Processing Algorithm unambiguous Doppler centroid frequency is then tracked by a burst mode clutterlock algorithm during the data process- The SIR-C survey processor utilizes a burst mode process- ing. The Doppler frequency rate is solely derived from the ing algorithm [Sack, 85], [Curlander, 91b]. The algorithm ephemeris parameters. Analysis results show that the accu- flow chart is shown in Figure 2. The survey processor is de- racy of the ephemeris is sufficient for generation of survey signed to process an entire data take into a strip image in products without employing the autofocus routine. approximately one-seventh the real time data collection rate. To attain high throughput rate, the data is bursted in az- 5.2 Standard Processing Algorithm imuth (slow time) with a one-quarter duty cycle factor. The data volume is further reduced by a factor of four in range (fast time) by processing the data using only one-quarter Prior to standard processing, preprocessing is employed to of the range chirp bandwidth. The azimuth compression iteratively refine the Doppler centroid frequency and the is performed using the spectral analysis (SPECAN) algo- Doppler frequency rate estimates using clutterlock and aut- rithm which requires fewer azimuth FFT's than the tradi- ofocus techniques [Li, 85]. tional matched filtering algorithm. Following azimuth com- estimated from the azimuth spectrum by locating the en- Doppler centroid frequency is pression, radiometric correction is applied to compensate for ergy centroid. Doppler frequency rate is estimated from the the along-track radiometric modulation. This is followed by look registration error by azimuth cross-correlating the look- a geometric rectification step that resamples the slant range- 1 and 100k-4 images obtained by spectral division. Identical Doppler image into the ground range cross-track and along- Doppler parameters are used for processing all polarimetric track domain. The rectified burst images are then overlaid data channels to ensure the phase coherency required for the to produce the final multi-look strip image. polarimetric data analysis. This approach will result in some For the survey processor, the initial Doppler centroid fre- exactly aligned. increase in azimuth ambiguities if the antenna beams are not quency is determined using a clutterlock routine and a ambiThe range-Doppler processing algorithm (i.e., the rectangu- guity resolution technique that requires a multiple PRF data 552 azimuth deskewed, single-look complex image lar algorithm) with secondary range compression and frequency domain range cell migration compensation was selected by SIR-C for standard processing [Wu, 82], [Jin, 84], [Curlander,91a]. The algorithm flowchart is shown in Figure Multl-lool Complex Single-lool Complex 3. The range compression and azimuth compression matched filtering operations are performed using the frequency domain fast convolution technique. Multl-lool Detected Oversampling and Siant-toGround Range Conversion All the signal data, in- dependent of the final products, are initially processed to single-look, complex imagery using the full azimuth processing bandwidth. This is followed by an azimuth deskew op- J. eration where the resulting deskewed, single-look complex Data Reduction (scattering matrix data) image is then radiometrically corrected. Multi-Look Filtering (intensity data) 1 Oversampling and Siant-toGround Range Conversion I Multi-Look Filtering (cross-prod uct data) _t raw data Data Reduction (cross-prod uct data) I Range Reference Generation ( -~d .:) 1..0. Figure 3b: Standard postprocessing algorithm flowchart. Standard Preprocessing resolution in azimuth and a 25 m or natural resolution in fd, fr range. The pixel spacing is selected to be 12.5 m in both range and azimuth. The filtering is applied to the cross- products. The data reduction function is then applied to the multi-look filtered cross-products data. Single-look Full-aperture Azimuth Reference Generation 6. HARDWARE ARCHITECTURE DESIGN t--"'""""'IIIOI Figure 4 shows the hardware architecture design of the SIR-C ground data processor. The entire processor system is composed of seven subsystems. The Data Transfer Subsystem (DTS) performs raw data reformatting and line synchronization. The SAR Correlator Subsystem (SCS) processes the SAR signal data into survey and standard image data. The azimuth deskewed, single-look complex image Output Products Subsystem (OPS) performs image data reformatting, recording and display. The Control Processor Executive (CPX) controls the processing sequence of the Figure 3a: Standard processing algorithm flowchart. above three subsystems. stores the information concerning the processing request and Following standard processing, postprocessing is employed processor status into database. The Calibration Subsystem to generate the final image product [Curlander, 91b]. Data (CAL) is used for generation of calibration parameters and reduction is the only postprocessing function for generation analysis of calibration site image quality. The Radar Data of single-look image products, where the data reduction function is applied to the scattering matrix. The Catalog Subsystem (CAS) Center (RDC) archives all the output data products. Major postpro- cessing functions for generation of multi-look image prod- The SCS consists of a STAR array processor with three com- ucts include cross-product generation, multi-look filtering putational modules, an Alliant FX/8 mini-supercomputer and data reduction where the multi-look filtering combines with eight compute elements and an Alliant FX/2800 mini- multi-looking as well as geometric rectification functions. For supercomputer with twelve i860-based CPU's. The STAR SIR-C, all the multi-look images will be filtered to a 25 m array processor is the main compute engine for survey proces- 553 SAR Correletor Subsystem Output Product Subsystem (OPS) (SC9ij) FX8·8 256 MB ~ ~ ~H:~~~~ ~~ 4GB DPS 4 GB LAN (Eth.rnot)I---......-~;....,.-.....""""""""'~-ooN"""I'¥!!.. I MM: 512 MB ICM: 8 x 1/2 MBI FX2800 ~~~~ ~~~~ ~~ ~~ I 2 VMEbus & CPU I 8GB Figure 4: SIR-C ground data processing system hardware architecture. sor. Its FFT performance is measured at 120 MFLOPS using developed using X-library routines. The operator interface three computational modules. The Alliant FX/8 is primar- software is developed using a graphics user interface software ily used for standard postprocessing functions. Its aggregate called Teleuse which runs on top of MOTIF. The image an- FFT performance nears 20 MFLOPS. Two SKYBOLT accel- notation is created using a commercially available software erator boards are installed to speed up the FX/8 computer, package called PV -WAVE. The catalog subsystem software which provide additional 100 MFLOPS compute power. The uses both FORTRAN and INGRES. FX/2800 is the main compute engine for standard processor and standard preprocessor. Its aggregate FFT performance is measured at over 300 MFLOPS. Computational tasks are 8. SUMMARY distributed over computers for concurrency processing in order to provide maximum processor throughput. Design and implementation of the SIR-C ground data proThe DTS consists of a high density digital recorder, a DE- cessing system is quite a challenge due to the large number MUX and two data quality analyzers (DQA). The DEMUX of radar modes and the large attitude errors/high attitude is used for selection of recorder channel for data processing. drift rates. In addition to the correlation software, there are The DQA is used for line synchronization and verifying the many software programs required for deriving parameters data quality and integrity. The OPS consists of Exabyte from the ancillary data in order to ensure that the output tape drives, Alden thermal printers and Kodak color print- image products are radiometrically calibrated and geomet- ers. Three subsystems, OPS, CAS and CAL, run on three rically registered. Another challenge to development of this separate SUN Sparc workstations. The image display and large software based system is its complex interfaces among operator interface display are handled via X-terminals. the many software programs. Clear interface definitions are essential to successfully deliver the operational system on schedule. 7. SOFTWARE DESIGN There are a variety of software packages used for develop- Currently, we are in the middle of developing all the proces- ing the SIR-C processor due to the need of specific applica- sor software. Major computer hardware will be installed by tions. The major part of the signal processing software is summer 1992. The end-to-end system integration will take written in FORTRAN while the input and output format- place in early 1993. The entire system is scheduled to begin ting software is written in C. The image display software is operations in late 1993. 554 Development of the SIR-C processor inherits a great deal of [Dubois, 89] P.C. Dubois, et aI, "Data Volume Reduction for experience from the previous and existing spaceborne and airborne SAR processors, such as SEASAT, SIR-B, and JPL Imaging Radar Polarimetry, " IEEE International Symposium on Antennas and Propagation, 1989, Vol III, pp.1354- AIRSAR. Experience accumulated from the SIR-C proces- 1357. sor will certainly benefit future processor design and devel- [Freeman, 89] A. Freeman and J.C. Curlander, "Radiometric opment, such as EOS SAR and RADARSAT. Correction and Calibration of SAR Images, " Photogrammetric Engineering and Remote Sensing, Vol. 55, No.9, September 1989, pp. 1293-1301. [Jin, 84] M. Jin and C. Wu, "A SAR Correlation Algo- ACKNOWLEDGEMENTS rithm which Accommodates Large Range Migration, " IEEE Transactions on Geoscience and Remote Sensing, Vol. GE- The research described in this paper was performed at the 22, No.6, November 1984, pp. 592-597. Jet Propulsion Laboratory, California Institute of Technology, under the contract with the National Aeronautics and [Jordan, 91] R. Jordan, B. Huneycutt, M. Werner, "SIR- Space Administration. CjX-SAR Synthetic Aperture Radar Systems, " Proceeding of the IEEE, Vol 79, No.6, pp. 827-838, June 1991. [Klein, 92] J.D. Klein, "Calibration of Complex Polarimetric SAR Imagery Using Backscatter Correlations, " IEEE Transactions on Aerospace and Electronic System, Vol. 28, No.1, pp. 183-194, January 1992. REFERENCES [Li, 85] F. Li, D. Held, J.C. Curlander, and C. Wu, "Doppler [Chang, 92a] C.Y. Chang and J .C. Curlander, "Applications Parameter Estimation for Spaceborne Synthetic Aperture of the Multiple PRF Technique to Resolve Doppler Centroid Radars, " IEEE Trans. on Geoscience and Remote Sensing, Estimation Ambiguity for Spaceborne SAR, " IEEE Trans- Vol. GE-23, No.1, January 1985, pp. 47-56. actions on Geoscience and Remote Sensing, September 1992. [Runge, 90 ] H. Runge and R. Bamler, "X-SAR Precision [Chang, 92b] C.Y. Chang and J.C. Curlander, "Attitude Processing, " Proceedings of the International Geoscience Steering for Space Shuttle Based Synthetic Aperture Radar, and Remote Sensing Symposium, College Park, Maryland, " Proceedings of 1992 International Geoscience and Remote May 1990. Sensing Symposium, Houston, May 1992. [Sack, 85] M. Sack, M.R. Ito, and LG. Cumming, "Appli- [Curlander, 91a] J.C. Curlander and R.N. McDonough, Syn- cation of Efficient Linear FM Matched Filtering Algorithms thetic Aperture Radar: Systems and Signal Processing, John to Synthetic Aperture Radar Processing, " lEE Proceedings, Wiley and Sons, 1991. Vol. 132, Pt. F, No.1, February 1985, pp. 45-57. [Curlander, 91b] J.C. Curlander and C.Y. Chang, "Tech- [Wu, 82] C. Wu, K.Y. Liu, and M. Jin, "Modeling and a niques in Processing Multi- Frequency Multi-Pol. Spaceborne Correlation Algorithm for Spaceborne SAR Signals, " IEEE SAR Data, " European Transactions on Telecommunica- Trans. on Aerospace and Electronic Systems, Vol. AES-18, tions, Vol. 2, No.6, pp. 605-617, November 1991. No.5, September 1982, pp. 563-575. 555

