QUALITY OF PHOTOGRAMMETRIC PRODUCTS
advertisement
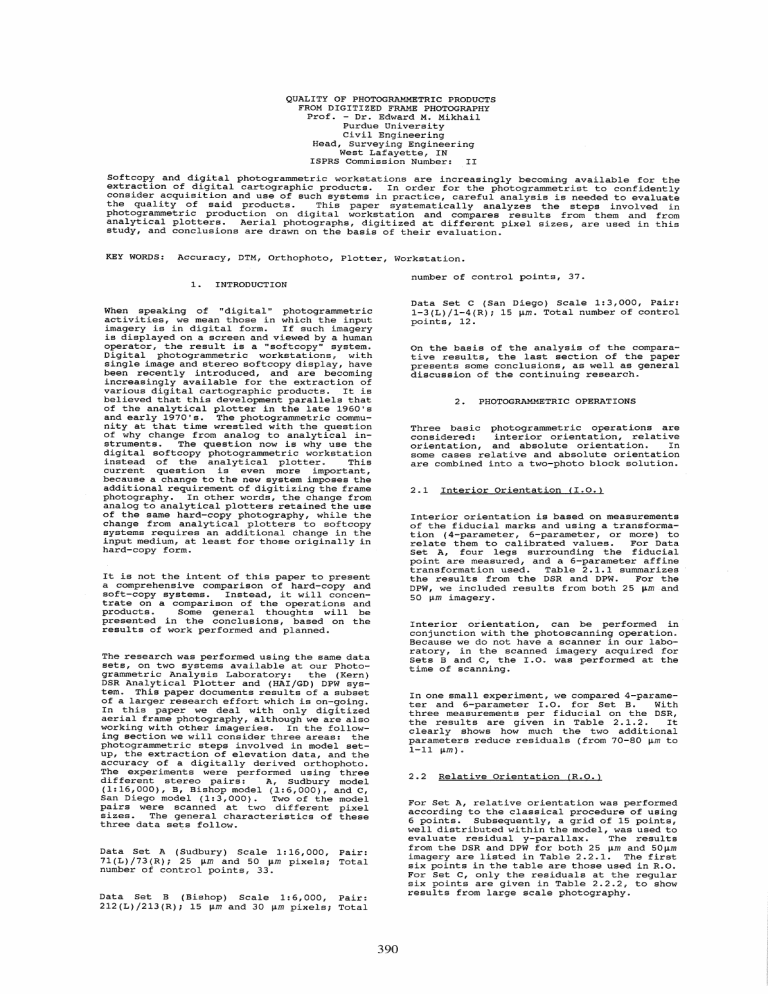
QUALITY OF PHOTOGRAMMETRIC PRODUCTS FROM DIGITIZED FRAME PHOTOGRAPHY Prof. - Dr. Edward M. Mikhail Purdue University Civil Engineering Head, Surveying Engineering West Lafayette, IN ISPRS Commission Number: II Softcopy and digital photogrammetric workstations are increasingly becoming available for the extraction of digital cartographic products. In order for the photogrammetrist to confidently consider acquisition and use of such systems in practice, careful analysis is needed to evaluate the quality of said products. This paper systematically analyzes the steps involved in photogrammetric production on digital workstation and compares results from them and from analytical plotters. Aerial photographs, digitized at different pixel sizes, are used in this study, and conclusions are drawn on the basis of their evaluation. KEY WORDS: Accuracy, DTM, Orthophoto, Plotter, Workstation. 1. number of control points, 37. INTRODUCTION Data Set C (San Diego) Scale 1:3,000, Pair: 1-3(L)/1-4(R); 15 J.Lm. Total number of control points, 12. When speaking of "digital" photogrammetric activities, we mean those in which the input imagery is in digital form. If such imagery is displayed on a screen and viewed by a human operator, the result is a "softcopy" system. Digital photogrammetric workstations, with single image and stereo softcopy display, have been recently introduced, and are becoming increasingly available for the extraction of various digital cartographic products. It is believed that this development parallels that of the analytical plotter in the late 1960's and early 1970's. The photogrammetric community at that time wrestled with the question of why change from analog to analytical instruments. The question now is why use the digital softcopy photogrammetric workstation instead of the analytical plotter. This current question is even more important, because a change to the new system imposes the additional requirement of digitizing the frame photography. In other words, the change from analog to analytical plotters retained the use of the same hard-copy photography, while the change from analytical plotters to softcopy systems requires an additional change in the input medium, at least for those originally in hard-copy form. On the basis of the analysis of the comparative results, the last section of the paper presents some conclusions, as well as general discussion of the continuing research. 2. PHOTOGRAMMETRIC OPERATIONS Three basic photogrammetric operations are considered: interior orientation, relative orientation, and absolute orientation. In some cases relative and absolute orientation are combined into a two-photo block solution. 2.1 Interior Orientation (1.0.) Interior orientation is based on measurements of the fiducial marks and using a transformation (4-parameter, 6-parameter, or more) to relate them to calibrated values. For Data Set A, four legs surrounding the fiducial point are measured, and a 6-parameter affine transformation used. Table 2.1.1 summarizes the results from the DSR and DPW. For the DPW, we included results from both 25 J.Lm and 50 J.Lm imagery. It is not the intent of this paper to present a comprehensive comparison of hard-copy and soft-copy systems. Instead, it will concentrate on a comparison of the operations and products. Some general thoughts will be presented in the conclusions, based on the results of work performed and planned. Interior orientation, can be performed in conjunction with the photoscanning operation. Because we do not have a scanner in our laboratory, in the scanned imagery acquired for Sets Band C, the 1.0. was performed at the time of scanning. The research was performed using the same data sets, on two systems available at our Photogrammetric Analysis Laboratory: the (Kern) DSR Analytical Plotter and (HAI/GD) DPW system. This paper documents results of a subset of a larger research effort which is on-going. In this paper we deal with only digitized aerial frame photography, although we are also working with other imageries. In the following section we will consider three areas: the photogrammetric steps involved in model setup, the extraction of elevation data, and the accuracy of a digitally derived orthophoto. The experiments were performed using three different stereo pairs: A, Sudbury model (1:16,000), B, Bishop model (1:6,000), and C, San Diego model (1:3,000). Two of the model pairs were scanned at two different pixel sizes. The general characteristics of these three data sets follow. In one small experiment, we compared 4-parameter and 6-parameter I.O. for Set B. With three measurements per fiducial on the DSR, the results are given in Table 2.1.2. It clearly shows how much the two additional parameters reduce residuals (from 70-80 J.Lm to 1-11 J.Lm). 2.2 Relative Orientation (R.O.) For Set A, relative orientation was performed according to the classical procedure of using 6 points. Subsequently, a grid of 15 points, well distributed within the model, was used to evaluate residual y-parallax. The results from the DSR and DPW for both 25 J.Lm and SOJ.Lm imagery are listed in Table 2.2.1. The first six points in the table are those used in R.O. For Set C, only the residuals at the regular six points are given in Table 2.2.2, to show results from large scale photography. Data Set A (Sudbury) Scale 1:16,000, Pair: 71 (L) /73 (R) i 25 J.Lm and 50 J.Lm pixels; Total number of control points, 33. Data Set B (Bishop) Scale 1:6,000, Pair: 212(L)/213(R); 15 J.Lm and 30 J.Lm pixels; Total 390 2.3 model; later those with errors exceeding 3 RMS were eliminated. Absolute Orientation (A.O.) In the DSR, absolute orientation is performed in the usual manner as a 7-parameter transformation. In the DPW, it is not, and therefore direct comparison is not strictly possible. Using 5 complete control points, For set A, we obtain transformation residuals in the DSR. On the DPW after A.O., we observed in 3-D the 5 points and calculated the coordinate differences from the control values. The results are given in Table 2.3.1. A better measure is on check points, where 26 points were used in both the DSR and DPW, as shown in Table 2.3.2. Data Set B (1:6,000) was used on the DSR and two sets of imageries, 15 ~m and 30 ~m, on the DPW. The results are tabulated in Table 2.3.3. For data Set C (1:3000), the results are given in Table 2.3.4. 3.3 Digital spot Heights In order to evaluate the capability of the automated DEM extraction method to obtain elevation "at a point", a very dense DEM grid is established around that point, with post spacing approximately equal to the ground pixel size. The elevation at that point as determined by the DEM is then compared to the control information. Tables 3.3.1, and 3.3.2 list the results at control points for data Sets Band C, respectively. Although bilinear interpolation is done, the elevation is essentially available at each pixel or post. 4. 3. Another useful product from digital imagery is the production of orthophotos using digital techniques. This technique is essentially automated: first a DEM is extracted to cover the model, then a ground sample distance, GSD, is selected for the orthophoto. For data set A (1:16,000), a 9m post spacing, 0.5m GSD for the 25 ~m imagery, and 0.8m GSD for the 50~m imagery, were selected. To evaluate the quality of these products, they are checked against "ground truth" in the form of control points. When an orthophoto is displayed on the monitor, an operator can point to a control point, the system will output the X,Y location and the Z-value interpolated from the DEM on line. Table 4.1.1 listsLlX, LlY, Llz between the control values and the observed coordinates. For data Set B (1:6000), 2m post spacing, 0.15m GSD for 15 ~m, and 0.30m for 30 ~m imagery are used; results are in Table 4.1.2. This is the cartographic product which lends itself to efficient extraction methodology by the digital workstations. Research and development in this area has been on-going for well over a decade. If the ultimate goal of digital photogrammetric systems, namely automating the extraction process, is to be fulfilled, it will begin with digital elevations. The DPW in our laboratory is capable of automatic extraction of such data, once the required specification parameters are input by the operator. The objective of our investigation was to test the accuracy of the resulting Digital Elevation Model, DEM. For this purpose, from two to four different areas (patches) were selected, in each of the three stereopairs, such that different terrain characteristics can be considered. The elevations were extracted, at the exact same post locations, both by an operator on the DSR and automatically on the DPW, and the values compared. 5. 3.1 Unedited DEM ANALYSIS, CONCLUSIONS, AND RECOMMENDATIONS So far, only results and factual details have been presented with little or no comments. In the following subsections, the results will be analyzed and pertinent conclusions and recommendations given. The post spacing for data Set A (1: 16,000 scale photography) is 12 m. Three different areas with 441, 342, and 324 posts were selected for testing. For the 25 ~m and 50~m digital imagery, each of the areas was run three separate times on the DPW: the first using the 21 x 21 posts, the second expanding it to 26 x 26 (a border of 5 more posts) and the third to 31 x 31 (10 post border). The reason for adding the extra posts was to eliminate border effects on matching, if any. The RMS of the post elevation differences from DSR and DPW are listed in Table 3.1.1. 5.1 Interior Orientation (I.O.) Only one data set was used on the DPW and therefore we cannot provide general indications. The conclusion to be drawn is the DPW provides at least as accurate a result as the DSR. The reason is likely to be that there is considerable flexibility in viewing, particularly in magnification range, on the DPW. Also, the increase in pixel size from 25~m to 50 ~m affected pointing only marginally. Future experimentation will verify this statement, as well as include automated fiducial reading using image matching techniques developed at Purdue over a decade ago. A 3m post spacing was used for Data Set B (1:6,000). Table 3.1.2 lists the RMS differences between the DSR and each of the 15~m and 30 ~m imageries. A 3m post spacing was also used for Data Set C ( 1: 3,000) . The results for two patches (one observed by two operators in the DSR) are summarized in Table 3.1.3. 3.2 DIGITAL ORTHOPHOTO DIGITAL ELEVATION DATA 5.2 Edited DEM Data Relative Orientation (R.O.) Residuals on the points used for R.O. (low redundancy) are essentially the same for DSR and DPW, when smaller pixel size is used, based on two data sets. When a larger pixel size (50 ~m) is used, R.O. is not as accurate as for the 25 ~m pixel size, using the same orientation procedure. A more effective test, is on the parallax check points. The RMS values are least for DSR (6 ~m), followed by DPW 25 ~m (9 ~m), and then DPW 50 11m (16 ~m). All are considered adequate; but again the limited data set preclude a general statement. Further work is in progress for more All the DEM data pertaining to the DPW are those directly obtained from the automated image matching procedure. Usually, in practice one edits those elevation posts which are inconsistent with the terrain. Tables 3.2.1, 3.2.2 and 3.2.3 give the results for Data Sets A, B, and C, respectively. It can be seen that at most 3% of the posts are edited. Furthermore, the largest error is less than 10 times the RMS (when included). The largest improvement is about 40%. Initially, editing was done by viewing the DEM over the stereo 391 results. 5.3 with respect to both printing and horizontal map accuracy standards. Absolute Orientation (A.O.) 5.7 If 25 ~m is considered the proper pixel size for data set A, A.O. is as accurate on the DPW as on the DSR (Table 2.3.1). Perhaps as to be expected, the 50 ~m imagery yields a slightly less accurate A.O. than the 25 ~m, which is also reflected in the results from the large number of check points, (Table 2.3.2). When 15 ~m and 30 ~m pixel sizes are used for the same imagery, the results are the same. This implies that as the scale gets larger, and pixel sizes suitable for such scales are selected, accuracy will not depend only on the pixel size, but also on the information content and limitations of the matching process. Again, it must be emphasized that more experiments are needed before a broad statement of accuracy expectation is drawn. 5.4 General Conclusions The author is convinced that the softcopy photogrammetric workstation is a viable alternative to the analytical plotter. On the whole, the quality of the cartographic products is good, and productivity is quite high. However, it must be emphasized that this is a preliminary conclusion and that more extensive testing will help build up more data on which firm and general conclusions can be drawn. There is no doubt, though, that the workstation will provide an excellent environment for advancing automation. This is true regarding not only DEM and orthophoto, but also planimetric features which were not dealt with in this paper. We continue our research in all aspects of digital softcopy photogrammetry, and more results will be forthcoming. Digital Elevation Models (DEM) ACKNOWLEDGEMENTS On the whole, the inclusion of a border to the area of DEM extraction does not seem to make significant difference. On the otherhand, when a larger pixel size is used the accuracy generally decreases. Even with completely unedited data, the results from automated DEM extraction on the DPW are quite reasonable as compared to those operator extracted on the DSR. Naturally, DEM data must be edited in order to eliminate gross errors. When this is done, the results are indeed good. For example, for 1:16,000 photography, 25 ~m pixel, the overall accuracy is 1/4000 of the flying height. It should be pointed out that this is as compared to DSR (not truth!), and not on specific target points, but on a large number of posts (1107), on the fly. For the 1/6000 photography, 15 ~m pixel, the ratio is about 1/3000 of the flying height on 2657 posts. Finally, for the 1:3000 photography, the ratio is 1/1500 of the flying height. Thus, the ratio ranges from 0.67% to 0.25%. 5.5 The author wishes to thank his colleagues Dr. Fidel Paderes and Dr. Jim Bethel for valuable discussions. He also acknowledges with thanks, the support of past and current graduate students: Veljko Jovanovic, Tom Lobonc, Kanok Weerawong, Ed Lutsky, and Tom Carson. Helava and Associates graciously provided scanning support, and their scientists Scott Miller and Kurt de Venecia were very helpful with the operation and training on the DPW. Digital spot Heights (DSH) This is a very experimental procedure, which we introduced to find an equivalent to spot height observation on an analytical plotter as explained in Section 3.3. Therefore the results are quite preliminary. For example, the effort did not work with the 1: 16000 photography • With the 1: 6000 and 1: 3000 photography, the results are encouraging. For the former, the ratio is 1/4500 of the flying height, and 1/3000 for the latter. These are not as good as those for the DSR (Table 3.3.1 and 3.3.2). 5.6 Digital Orthophoto For data set A (1:16,000), with 0.5m GSD, the RMS in X or Y averages out to about one GSD. With regard to elevation interpolation, comparison with stereo softcopy viewing yields (Tables 4.1.1 and 2.3.2): 0.82 vs 0.40 and 0.89 vs 0.63. For data set B (1:6,000), with o .15m GSD, the RMS in X or Y exceeds this value, while for the 0.30m GSD, the values are much less than the GSD. Further investigation indicated a distinct operator difference, with lower reliability for the 0.15m GSD case. Elevation comparison shows (Tables 4.1.2 and 2.3.3) 0.19 vs 0.11 and 0.16 vs 0.11. It can be fairly said that elevation interpolation when mono viewing on an orthophoto is less accurate than stereo viewing. Also, the quality of the orthophoto is consistent with the specified GSD. The values obtained from the accuracy evaluation can be used to establish the scale of the produced orthophoto, 392 Table 2.1.1 DSR DPW (25) DPW (50) DSR DPW (25) DPW (50) Interior Orientation Residuals x y x 4 -10 -4 2 -1 -1 1 1 -5 3 5 -3 -5 2 -1 -16 -1 -2 1 -1 -4 1 Table 2.1.2 y x x y (~) y Left Photograph 10 -4 4 -10 10 4 10 -1 -1 1 1 -5 3 5 Right Photograph 16 2 -16 -2 1 -1 -1 1 16 1 2 16 1 1 4 1 4 4 -1 -1 -4 1 DSR Interior Orientation Residuals x y x 4-par 6-par -66 11 -71 1 4-par 6-par -80 2 -83 y x x y (~) y 76 -1 75 11 74 -10 79 -2 Right Photograph -81 86 80 84 2 2 -2 -3 85 2 82 82 2 2 Table 2.2.1 Relative Orientation Residuals (~) Set A 1 2 2 -1 3 -1 10 -9 -4 19 -18 4 1 3 5 -1 -1 8 6 1 2 -9 7 -5 o 29 8 -8 -1 -1 9 -3 -14 o 10 4 o -1 11 2 12 13 -7 13 14 8 -15 -15 15 15 15 16 17 18 19 20 21 6 RMS* * -2 DPW (50) o -1 o o 2 o o -29 3 -15 o 33 1 15 -7 o -30 28 7 1 -1 6 -15 o 6 9 16 Only for the 15 check points (7-21) Table 2.2.2 Relative Orientation Residuals (~) - Set C No. X 74 166 203 25 58 RMS -.01 .11 .12 .03 .05 .08 DSR DPW (15,um) 1 1 o 2 -1 -1 3 2 4 o o 5 1 6 1 o o o RMS .8 .9 Absolute Orientation Control Residuals - Set A DSR(rn) Y Z X DPW (25) Y Z X Y z -.11 .05 .02 -.02 .06 .06 .00 .05 .01 .04 -.08 .05 .00 -.01 .04 .07 -.08 .05 .06 -.01 -.04 -.01 .00 .03 -.01 -.01 .00 -.01 .02 .01 .38 -.29 .03 -.20 -.05 .23 .06 -.15 .28 -.07 -.27 .19 -.15 -.14 .27 -.02 .02 .15 Table 2.3.2. Point DSR(rn) X Y z X 51 50 106 24 49 108 .06 .07 - .18 -.16 - .14 .00 .13 -.05 -.02 -.04 .17 - .06 .00 .03 -.09 -.04 .08 .00 52 54 53 48 47 46 .22 .06 .16 .00 .03 -.02 .14 .20 .10 .08 .16 72 .11 56 .11 71 .16 .10 .20 .30 57 28 44 55 30 40 41 164 197 206 RMS .19 .16 .10 .05 .08 .04 .02 .06 .13 393 DPW (50) Stereornodel Check Points Residuals - Set A No. 29 Point 1 Table 2.3.1 Point DPW (25 ) DSR Point - Set B Left Photograph -77 88 72 -83 0 11 1 -11 61 -2 - Set A .03 .04 - .17 .20 -.02 .08 .16 .09 .17 .04 .22 .05 .16 .03 .14 .08 .09 .12 - .11 .13 -.09 .03 .04 .16 - .11 .02 -.17 -.25 .02 .14 .14 .03 .04 -.03 -.13 .30 .01 -.16 .09 .12 .07 .31 .14 .05 -.04 .04 -.10 .00 .00 .00 .10 -.05 .00 .02 .04 .00 .00 .00 -.22 .00 .18 .00 .00 .07 DPW( 25) Y .14 - .20 .03 .11 - .15 .00 .16 -.11 -.08 .28 .00 .00 .00 -.09 -.17 .00 .06 -.08 .00 .00 .00 .13 .00 .05 .00 .00 .10 Z .70 -.10 .40 .40 .4 - .10 .60 -.20 -.40 .50 .00 .20 .00 -.30 -.90 .10 .00 -.20 -.50 .00 -.60 .80 .00 .40 -.20 .10 .40 X DPW(50) Y Z .60 .33 .31 .89 .00 -.08 .30 .50 .40 -.39 -.02 .00 .15 .08 .25 .15 .06 .33 .42 .25 .00 -.04 -.02 -.31 .62 .23 .00 .96 -.02 .19 .00 .00 -.08 .13 .00 -.02 1.40 .60 .00 1.20 .40 .00 .60 .60 -.10 1.50 .30 .70 .40 .50 .10 -.40 -.50 -.90 .40 - .40 .50 -.20 .40 .63 .41 -.08 .21 .00 .00 .02 .12 .00 .08 .46 - .12 .02 .02 -.04 .23 .54 .19 -.08 .08 - .15 .33 Table 2.3.3 Check Points Elevations (m) after A.O. - Set B Point No. DSR 942 930 940 904 950 55 50 59 58 57 53 52 51 48 47 54 49 38 37 56 36 24 23 22 21 20 .05 .08 -.09 .03 -.05 Z .14 .00 .03 .17 -.01 .00 .07 .10 -.08 -.21 .11 .07 .17 -.12 -.03 - .13 .02 -.09 -.09 -.12 .01 .00 -.05 9 8 .02 -.09 .09 7 6 RMS DPW (15) Z DPW (30) -.10 Table 3.1.2 RMS of DEM Differences (m) Between DSR and DPW - Data Set B Area - .11 3 4 o Area 1 2(a) 2(b) .01 .05 .14 -.07 .10 .00 .00 .02 -.20 o +5 +10 Table 3.2.1 .13 .00 -.13 Area Pixel .10 -.22 .10 -.02 1 25 50 .11 .11 2 3 17 25 23 30 DSR DPW (15) -.01 .04 -.20 -.01 - .10 -.07 .01 .02 .06 -.04 -.02 -.01 .04 31 10 26 24 RMS Comb. -.09 .09 .05 .18 .11 Table 3.1.1 RMS of DEM Differences (ill) Between DSR and DPW - Data Set A Area No. of Posts 441 324 342 1 2 3 o +5 +10 25 o .96 .43 .69 J1m imagery +5 +10 1. 02 .49 .37 imagery +5 +10 .41 .48 .38 .28 .40 .48 .46 .24 30 o .53 .54 .69 .44 J1m imagery +5 +10 .56 .56 .74 .43 .56 .56 .43 .39 15J.l1ll Imagery No. of Posts o +5 +10 256 441 441 .28 .55 .58 .24 .43 .45 .25 .58 .64 a = operator 1 b operator 2 Table 2.3.4 Check Points Elevations (m) after A.O. Set C Point No. No. J1m Table 3.1.3 RMS of DEM Differences (m) Between DSR and DPW - Data Set C .11 .00 .08 .00 .03 -.10 -.03 o means using the exact DEM area means an extra 5-post border means an extra 10-post border +5 +10 -.10 -.05 .05 -.16 -.17 -.10 -.10 .39 .49 .67 .29 2 .09 .23 .22 .03 -.08 - .19 -.30 -.05 - .19 961 187 880 629 1 .17 .10 .10 .03 .08 -.10 .03 -.02 -.10 15 Z .20 .04 -.02 -.02 .04 -.02 -.02 -.03 .00 - .10 No. of posts .92 .50 .54 50 o 1.24 .71 .42 J1m imagery +5 +10 1. 35 1. 08 .69 .79 .55 .46 means using the exact DEM area means an extra 5-post border means an extra 10-post border 394 means using the exact DEM area means an extra 5-post border means an extra 10-post border RMS of Edited DEM Results (m) - Data Set A No. of Posts No. Deleted Largest Value 441 441 8 (2%) 5 (1%) 5.98 3.92 25 50 324 324 4 (1%) 1. 61 25 50 342 342 25 50 1107 1107 o o 3 (1%) -1. 58 RMS b .96 1. 24 .80 (17%) 1.18 (5%) .43 .41 (5%) .71 .71 .69 .41 .69 .40 .75 .90 .67 .87 Table 3.2.2 RMS of Edited DEM Results (m) - Data Set B No. of Area Pixel 1 2 Posts 15 961 30 961 15 30 187 187 880 880 15 30 3 629 629 15 30 4 No. of Area 1 2(a) 2(b) (a) Comb. (b) Comb. (a+b) -2.15 2.65 .39 .53 . 31 (21%) .46 (13%) (2%) 5 (3%) 1. 94 2.85 .49 .54 .42 (14%) 19 (2%) 24 (3%) 5 (1%) 1 6.26 6.52 -1. 00 -1. 38 .67 .69 .29 .44 .49 .57 .43 (20%) DEM (30) .16 .15 - .03 - .35 942 930 .05 .08 .0 .04 940 904 950 -.09 .03 -.05 .14 .0 -.33 -.36 -.20 - .11 -.24 .03 -.02 .0 .05 - .36 -.26 .09 -.01 .06 .0 -.01 .28 (3%) .43 (2%) 57 53 52 51 48 .10 -.08 47 54 -.21 -.25 -.11 -.22 -.07 -.02 -.38 .11 -.44 49 38 .07 .17 .36 .02 37 56 36 -.12 -.03 - .13 -.30 -.21 -.19 - .14 24 23 22 .02 .09 -.09 -.05 -.06 -.03 -.29 - .29 21 20 .07 -.07 -.22 - .19 9 -.12 .01 .00 8 -.05 -.16 7 6 .02 .09 .10 .02 .09 -.01 .01 RMS .09 .20 .20 .39 .45 Deleted Value 256 441 3(1%) 14(3%) 1.11 3.78 .28 .55 .25(11%) .32(42%) 441 697 697 12(3%) 2.65 .58 .47 .49 .41(29%) .30 .36 .51 .34 a = operator 1 b Z .51 (24%) .46 (33%) Large 1138 DEM Z (15) Z 55 50 59 No. Posts DSR Point No . RMS of Edited DEM Results (m) - Data Set C Table 3.2.3 Comb. Value 23 (2%) 18 (2%) 4 Digital spot Heights Errors (m) - Set B Largest 2657 2657 15 30 Comb. No. Deleted Table 3.3.1 operator 2 .0 .07 .02 .04 -.22 - .19 -.08 .23 .18 - .09 .09 .19 Table 3.3.2 Digital Spot Heights Errors (m) - Set C Z (15) Z -.05 - .12 - .04 10 26 -.02 14 18 24 .01 .02 -.01 32 15 -.01 (c) -.02 (c) -.01 -.23 .0 .05 .01 -.07 -.21 -.15 .18 17 23 25 30 31 RMS c wjo c 395 DEM DSR Point No. .08 (c) .01 (c) -.33 .02 .06 .04 (wjo c) .04 .16 used as control point in AO RMS calculated without these points Table 4.1.1 Orthophoto Check Points Table 4.1.2 Residuals m - Set A Points No. 74 25 ~X - .38 J1m image ~Y .34 50 ~Z .48 -.39 Orthophoto Check Points Residuals (m) J1m Point image .20 15 J1m - Set B Image No. DX 942 .03 -.15 .64 930 - .11 30 J1m Image DX DY .05 - .13 - .05 .03 .11 .20 - .04 - .14 .08 DY DZ DZ 52 - .15 .51 .56 -.50 .05 .57 940 -.34 - .06 -.09 - .08 - .04 .30 .26 -.07 -.12 -.05 904 .11 -.02 -.16 - .07 24 -1.19 2.15 3.08 -.95 .86 1. 24 950 -.23 - .11 -.37 - .13 .03 106 .46 .19 .08 .03 - .23 49 - .70 1. 00 1.17 -.51 .53 .45 55 - .14 .42 -.12 .06 -.12 53 -.59 .70 .50 .40 .22 50 - .15 .56 .13 .00 -.03 .03 - .08 .21 54 -.15 .30 .33 .09 .12 - .23 .06 59 - .13 .12 .20 .08 -.01 48 .48 .81 .85 .31 .32 .18 58 -.20 .01 -.40 .02 - .03 .08 47 .93 1. 33 1.43 .70 .56 .57 57 -.33 .01 -.39 .05 -.06 .01 46 .30 .00 -.05 -.63 .36 .17 53 -.20 .40 -.09 .04 .00 - .12 72 .33 .44 .03 .03 -.10 -.59 52 - .20 .40 .12 - .08 .02 .23 56 .04 .41 .14 -.66 .79 1.61 51 -.26 .40 .01 .02 .28 71 .07 .15 -.25 -.46 .69 1. 04 48 -.26 -.27 .07 - .06 -.01 .07 -.19 57 .00 .04 .54 -.07 .85 .57 54 .07 -.27 -.44 .00 -.14 - .03 28 .00 .00 .20 -2.05 1. 29 2,90 49 .13 -.27 .12 -.08 .01 - .19 44 .00 .20 -.82 .93 .89 38 .33 .12 -.17 -.01 -.13 -.07 29 .00 - .83 .38 .87 -.30 .46 -.27 37 .07 - .33 .02 -.08 -.01 -.29 55 -.04 .08 .20 .25 .81 .46 56 .07 -.46 -.03 -.04 -.06 -.23 -.27 30 .00 .00 .60 -.39 1.00 -.01 36 .07 -.01 .11 .00 .05 41 .00 .08 - .10 -.92 .80 .43 24 - .13 .18 .06 -.05 - .14 .03 164 -.04 .13 .72 -.25 1. 22 .58 23 - .13 .18 -.27 .00 -.16 - . 17 166 .13 .08 .09 .51 .97 .27 22 -.13 .12 - .19 .04 -.01 -.06 197 .08 .13 -.26 -1. 20 .49 .92 21 -.20 .05 .05 .01 .01 -.08 203 .00 -.10 -1.67 .47 1.19 20 -.13 -.01 .04 -.05 - .02 -.07 206 .00 - .08 .21 .31 -.96 .89 .48 9 -.33 .05 -.08 -.04 .07 -.09 RMS .42 .62 .82 .77 .70 .89 8 -.07 -.01 - .11 - .03 .09 .01 RMS .19 .26 .19 .06 .C8 .16 396
