K for a Competitive Enzyme Inhibitor
advertisement
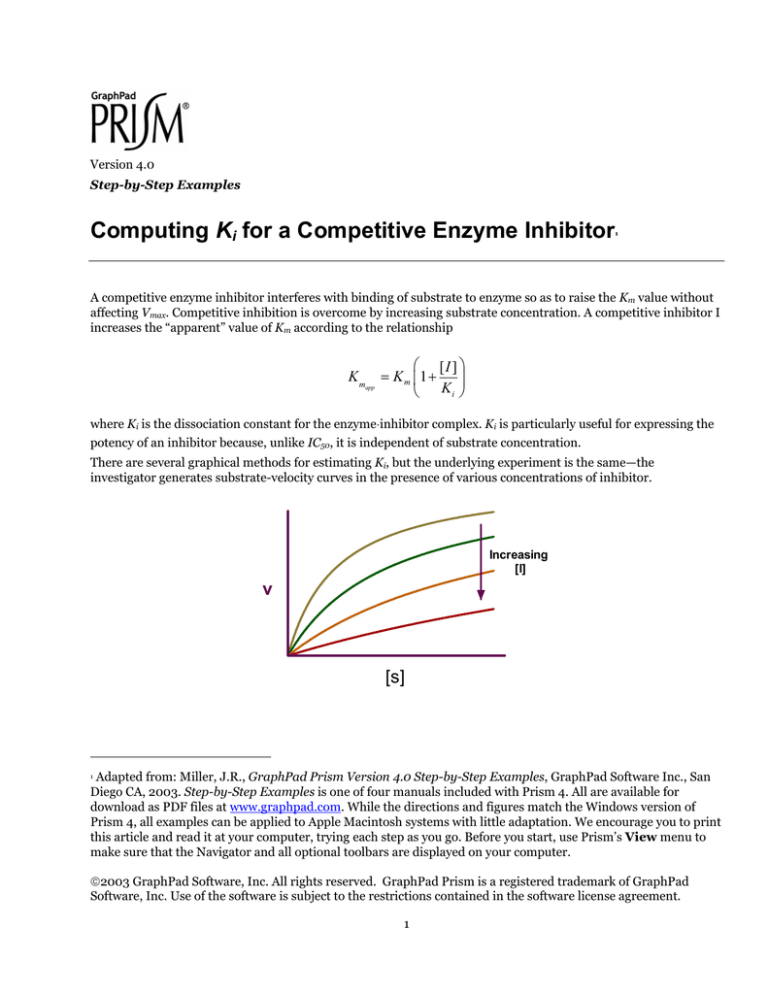
Version 4.0 Step-by-Step Examples Computing Ki for a Competitive Enzyme Inhibitor 1 A competitive enzyme inhibitor interferes with binding of substrate to enzyme so as to raise the Km value without affecting Vmax. Competitive inhibition is overcome by increasing substrate concentration. A competitive inhibitor I increases the “apparent” value of Km according to the relationship Km app [I ] = K m 1 + Ki where Ki is the dissociation constant for the enzyme·inhibitor complex. Ki is particularly useful for expressing the potency of an inhibitor because, unlike IC50, it is independent of substrate concentration. There are several graphical methods for estimating Ki, but the underlying experiment is the same—the investigator generates substrate-velocity curves in the presence of various concentrations of inhibitor. Increasing [I] v [s] 1 Adapted from: Miller, J.R., GraphPad Prism Version 4.0 Step-by-Step Examples, GraphPad Software Inc., San Diego CA, 2003. Step-by-Step Examples is one of four manuals included with Prism 4. All are available for download as PDF files at www.graphpad.com. While the directions and figures match the Windows version of Prism 4, all examples can be applied to Apple Macintosh systems with little adaptation. We encourage you to print this article and read it at your computer, trying each step as you go. Before you start, use Prism’s View menu to make sure that the Navigator and all optional toolbars are displayed on your computer. 2003 GraphPad Software, Inc. All rights reserved. GraphPad Prism is a registered trademark of GraphPad Software, Inc. Use of the software is subject to the restrictions contained in the software license agreement. 1 Formerly, Ki estimation required linearizing transforms and replots, but Prism offers two improvements. First, the kinetic constants are more quickly and reliably estimated directly from nonlinear regression. Second, part of the function of replotting is replaced by global (shared-parameter) curve fitting. The rate equation is v= Vmax [ S ] [I ] K m 1 + + [S ] K i In the family of substrate velocity curves, [S] and [I] are independent variables, [I] changing with each curve in the family. But Vmax, Km, and Ki are intrinsic to the system and therefore common to all the curves. Prism can perform a global curve fit, finding the single best-fit estimates of Vmax, Km, and Ki for all curves taken together. This article includes the following special techniques: Global (shared-parameter) curve fitting Fitting data to a user-defined equation—entering the equation and setting rules for initial values Constraining fitted parameters—designating parameters to be shared among multiple data sets and fixing parameters to values extracted from data tables Segmented (gapped) axes Entering and Graphing the Data In the Welcome dialog, make the settings shown below. Complete the data table as shown below. The X column holds substrate concentrations, while each Y column holds the velocity value measured at the inhibitor concentration shown in the heading for that column. 2 For this example, we’re assuming that the units of [S] and [I] are nM, and the units of velocity are µmol/min/mg protein. The units notations in the column headings above are useful but optional. Prism will show those units in the graph legend, but simply extract the numeric portion of the column heading for its curve-fitting analysis. Prism is indifferent to these units—it is for you to remember that data on Results sheets are in units that match your input data (thus, nM for Km and Ki, µmol/min/mg protein for Vmax). Click the yellow Graphs tab to display the graph. Most of the points are crowded at the left-hand side of the graph. We’ll fix that later. Click Analyze. In the Analyze Data dialog, choose Nonlinear regression (curve fit) from the Curves & regression list. In the Parameters: Nonlinear Regression (Curve Fit) dialog, verify that the Equation tab is selected and then choose More equations. In the list below, select [Enter your own equation]. The User-defined Equation dialog opens. Give your user-defined equation a name, then enter the two-line system shown: The first line defines an intermediate variable equal to the apparent Km as discussed earlier. Km app [I ] = K m 1 + Ki The right-hand side of that equation will be substituted for “Kmapp” in the second line, and Prism will fit the resulting equation to each data set. The second line is the same as the velocity equation given earlier, v= Vmax [ S ] [I ] K m 1 + + [S ] K i 3 after substituting “X” for the independent variable [S]. The multiplication operator * in the first line isn’t strictly necessary, but it’s good practice to always include it. Prism allows implied multiplication, but it must not lead to ambiguity. For example, Prism will read “AB” as a parameter with that name, not as the product of A and B. Refer to the Prism User’s Guide for more information about the rules for writing user-defined equations. We must now tell Prism (a) what parameters to treat as “shared” among data sets and (b) what values to use for [I] in the case of each data set. Designating Global (Shared) Parameters Select the Default Constraints tab. Prism identifies and displays the equation parameters to be fitted by nonlinear regression. Km, Ki, and Vmax are common to all data sets, so select Shared value for all data sets for those parameters. Remember that, in the presence of inhibitor, the apparent Km changes, not Km itself. Km is a global parameter. The settings are shown below. Leave this dialog open as you proceed to the next section. Note that we have just specified shared parameters and constants in the User-defined Equation dialog. That means that these settings will apply whenever we use this user-defined model. You can also make these settings under the Constraints tab in the Parameters: Nonlinear Regression (Curve Fit) dialog. In that case, the settings will apply only to the analysis you’re running when you make the settings and will not be part of the equation definition. 4 Assigning Parameter Values from Y-Column Headings Next to “I” (see dialog above), select Data set constant (=column title). This causes Prism to fit a different equation to each data set, in that it will set [I] equal to the numerical portion of the Y column heading for that data set. Column heading constants are a powerful feature that effectively allows you to have a second independent variable. Completing the Curve Fit Select the Rules for Initial Values tab. Enter initial-values rules as shown below (for more on setting for initial values, see the Step-by-Step Example “Fitting Data to User-Defined Equations”. Click OK twice to exit the Parameters dialogs and perform the curve fit. Here is a partial view of the Results sheet: 5 The values for fitted (remember that I is constrained) parameters in all columns are the same because they are all shared parameters. The object here is to get the best estimate for Ki, and that has been done by fitting the parameters globally. If you want to change any of the parameter settings and re-run the curve fit, choose Change… Analysis Parameters. Graph of the Fitted Data Click on the yellow Graphs tab to display the graph. The curves measured at higher inhibitor concentrations are not covered as uniformly by the data points. We wanted to keep the data table in this example simple; in an actual experiment, consider using a different distribution of substrate concentrations at different concentrations of inhibitor. You don’t have to use the same X values for each data set on your table. For an example of using different X values, see the Step-by-Step Example “Analyzing Dose-Response Data”. 100 0 nM 3 nM 10 nM 30 nM 75 50 25 0 0 2500 5000 7500 10000 12500 We can address the crowding of points into the left-hand side of the graph by dividing the X axis into two segments. Placing a Gap in the X Axis In this section, we’ll segment the X axis to eliminate the space between X = 1050 and X = 9000 and to use different scales for each segment: 6 Velocity (µmol/min/mg) 80 [Inhibitor], nM 60 0 nM 3 nM 10 nM 30 nM 40 20 0 0 250 500 750 1000 10000 Concentration substrate (nM) Family of Substrate-Velocity Curves with Gapped (Segmented) X Axis See text for instructions on producing the gap. The graph includes other formatting changes covered elsewhere in this book. Double-click on the X axis to open the Format Axes dialog. Make sure the X axis tab is selected. Under Gaps and Direction, choose to divide the axis into Two segments. Now you must set range and tick options for each segment. Select Left from the list box labeled Segment. Set the range and tick options for the left segment as follows: Now select Right from the Segment list box, then set the range and tick options for the right segment as follows: For other graphs, these settings may require some experimentation. A particularly tricky part may be to decide on the relative lengths of the segments (Length % of axis). An easy way to adjust this is to switch to the graph, click 7 to select either of the segments, then drag the end of that segment to adjust its length. Prism then adjusts the Length % of axis setting automatically. 8
