124 Borensztein et al Table 1
advertisement
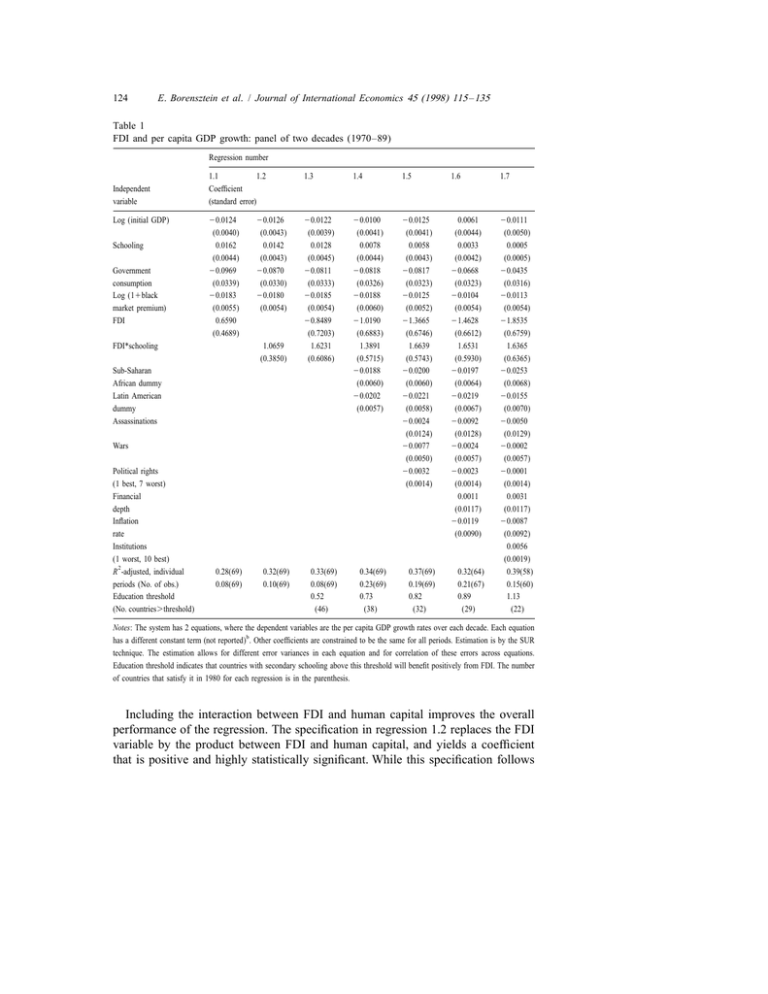
124 E. Borensztein et al. / Journal of International Economics 45 (1998) 115 – 135 Table 1 FDI and per capita GDP growth: panel of two decades (1970–89) Regression number Independent variable Log (initial GDP) Schooling Government consumption Log (11black market premium) FDI 1.1 1.2 Coefficient (standard error) 1.3 1.4 1.5 1.6 1.7 20.0124 (0.0040) 0.0162 (0.0044) 20.0969 (0.0339) 20.0183 (0.0055) 0.6590 (0.4689) 20.0122 (0.0039) 0.0128 (0.0045) 20.0811 (0.0333) 20.0185 (0.0054) 20.8489 (0.7203) 1.6231 (0.6086) 20.0100 (0.0041) 0.0078 (0.0044) 20.0818 (0.0326) 20.0188 (0.0060) 21.0190 (0.6883) 1.3891 (0.5715) 20.0188 (0.0060) 20.0202 (0.0057) 20.0125 (0.0041) 0.0058 (0.0043) 20.0817 (0.0323) 20.0125 (0.0052) 21.3665 (0.6746) 1.6639 (0.5743) 20.0200 (0.0060) 20.0221 (0.0058) 20.0024 (0.0124) 20.0077 (0.0050) 20.0032 (0.0014) 0.0061 (0.0044) 0.0033 (0.0042) 20.0668 (0.0323) 20.0104 (0.0054) 21.4628 (0.6612) 1.6531 (0.5930) 20.0197 (0.0064) 20.0219 (0.0067) 20.0092 (0.0128) 20.0024 (0.0057) 20.0023 (0.0014) 0.0011 (0.0117) 20.0119 (0.0090) 20.0111 (0.0050) 0.0005 (0.0005) 20.0435 (0.0316) 20.0113 (0.0054) 21.8535 (0.6759) 1.6365 (0.6365) 20.0253 (0.0068) 20.0155 (0.0070) 20.0050 (0.0129) 20.0002 (0.0057) 20.0001 (0.0014) 0.0031 (0.0117) 20.0087 (0.0092) 0.0056 (0.0019) 0.39(58) 0.15(60) 1.13 (22) FDI*schooling 20.0126 (0.0043) 0.0142 (0.0043) 20.0870 (0.0330) 20.0180 (0.0054) 1.0659 (0.3850) Sub-Saharan African dummy Latin American dummy Assassinations Wars Political rights (1 best, 7 worst) Financial depth Inflation rate Institutions (1 worst, 10 best) R 2 -adjusted, individual periods (No. of obs.) Education threshold (No. countries.threshold) 0.28(69) 0.08(69) 0.32(69) 0.10(69) 0.33(69) 0.08(69) 0.52 (46) 0.34(69) 0.23(69) 0.73 (38) 0.37(69) 0.19(69) 0.82 (32) 0.32(64) 0.21(67) 0.89 (29) Notes: The system has 2 equations, where the dependent variables are the per capita GDP growth rates over each decade. Each equation has a different constant term (not reported)b . Other coefficients are constrained to be the same for all periods. Estimation is by the SUR technique. The estimation allows for different error variances in each equation and for correlation of these errors across equations. Education threshold indicates that countries with secondary schooling above this threshold will benefit positively from FDI. The number of countries that satisfy it in 1980 for each regression is in the parenthesis. Including the interaction between FDI and human capital improves the overall performance of the regression. The specification in regression 1.2 replaces the FDI variable by the product between FDI and human capital, and yields a coefficient that is positive and highly statistically significant. While this specification follows −0.17 −0.78 −1.10 −0.41 −0.52 −0.14 1.39 −1.27 Japan Germany Italy Belgium Australia Austria Dutch Canada 1.30 (4.02) 1.09 (3.72) 1.27 (3.21) 0.85 (2.63) 0.26 (1.10) 0.38 (1.20) 0.39 (1.48) 1.99 (5.50) 0.82 (2.51) 0.36 (1.25) 0.42 (1.26) 0.82 (2.45) 0.57 (8.07) 0.28 (4.07) 0.13 (1.45) 0.18 (2.52) 0.18 (3.50) 0.06 (0.84) 0.03 (0.44) 0.33 (4.03) 0.05 (0.71) 0.35 (5.67) 0.30 (4.01) 0.40 (5.39) 0.06 (3.60) 0.07 (4.21) 0.07 (2.98) 0.19 (7.06) 0.14 (9.64) 0.04 (1.90) 0.09 (5.21) 0.04 (1.51) 0.09 (3.67) 0.07 (3.59) 0.12 (5.29) — — 0.94 (4.11) — 0.39 (1.69) 0.76 (9.18) 1.51 (13.23) 0.80 (1.14) 0.21 (1.34) 0.67 (2.73) 1.28 (10.38) 2.77 (7.67) — Own colony 0.08 (1.33) 0.02 (0.41) 0.25 (4.01) 0.12 (2.29) 0.15 (3.78) 0.07 (1.32) 0.22 (5.06) 0.23 (3.82) 0.04 (0.45) 0.18 (3.76) 0.47 (5.29) 0.19 (2.22) Other colony 40.09 (4.14) 0.34 (0.36) 3.16 (2.54) 0.67 (0.66) 1.22 (1.63) −0.10 (0.10) −0.77 (0.91) 3.46 (2.96) 2.37 (2.01) 1.23 (1.38) 1.18 (1.09) 1.17 (1.06) Egypt 5.04 (3.94) −5.99 (6.28) 0.38 (0.29) 0.74 (0.73) 3.43 (4.67) 2.39 (2.45) 1.51 (1.83) −2.28 (1.98) 4.64 (4.07) 2.56 (2.95) −2.50 (2.38) 0.67 (0.63) Israel 0.01 (1.98) 0.002 (0.26) −0.006 (0.73) −0.01 (1.60) 0.008 (1.50) 0.03 (4.13) 0.03 (5.69) −0.05 (5.69) 0.03 (3.25) −0.006 (0.92) −0.006 (0.81) 0.001 (1.73) Muslim 0.01 (1.69) 0.00 (0.00) 0.004 (0.45) −0.02 (2.17) 0.003 (0.60) 0.03 (3.89) 0.04 (6.24) −0.05 (6.43) 0.01 (1.86) 0.02 (2.36) 0.001 (0.13) 0.009 (1.16) Roman Catholic −0.004 (0.50) 0.002 (0.24) −0.02 (2.66) −0.02 (2.35) −0.008 (1.36) 0.17 (0.22) 0.01 (1.60) −0.03 (2.89) 0.01 (1.23) −0.13 (0.19) −0.007 (0.85) 0.62 (0.76) Other Relig. 0.50 0.41 0.48 0.47 0.55 0.54 0.56 0.51 0.62 0.60 0.58 0.50 R2 Note: Standard errors calculated with White’s correction for heteroskedasticity. t-statistics in parentheses. Coefficients on time dummies not reported. 1.96 −0.61 France Scandinavia −1.17 1.84 United Kingdom United States UN Income Openness Democracy Friend Table 5. OLS regressions: Dependent Variable: Log of aid (five-year averages), 1970 to 1994. 408 398 400 378 402 398 385 398 390 394 390 364 0.93 0.92 0.96 0.87 0.70 0.94 0.93 0.97 0.94 0.82 0.94 0.90 # of Non-zero obs. share WHO GIVES FOREIGN AID TO WHOM AND WHY? 43 Asia Sub-Saharan Africa Debt Rescheduling -0.061 (0.27) - 0.008 (0.48) ~ 0.033 (1.74) (2.17) 0.105 growth rate Terms of Trade (3.03) - 1.931 (0.53) 0.003 (0.26) - 0.007 (0.44) 0.02 1 (2.66) -0.168 (4.12) 1.988 (1.29) - 0.027 (2.05) 0.022 (1.60) 0.003 (0.76) -0.310 (1.01) 0.482 - 0.014 (3.10) 0.173 - 0.002 (0.44) 0.873 growth rate Population (2.63) (1.06) (2.54) Per capita GNP (0.22) - 0.068 0.030 (0.17) 0.035 - 0.034 Indirect taxes/GNP III (0.37) 0.240 (1.14) - 0.006 (0.03) 0.150 (2.04) 1.724 (2.51) - 22.00 (0.23) 0.040 (1.02) 0.062 (1.44) -0.010 (2.00) 0.200 (0.97) 4.449 (0.32) 0.018 (1.04) - 0.563 (0.42) 0.034 - 0.202 Alog Infant Mortality V (0.59) ~ 0.005 (0.78) - 0.028 (3.40) 0.002 (0.18) 0.089 (0.76) - 0.072 (0.31) ~ 0.004 (1.28) 0.076 (0.29) - 0.005 - 0.024 Alog life expectancy VI (4.28) - 0.014 (0.34) 0.062 (1.31) 0.047 (0.30) 4.198 (1.90) 0.667 (2.17) - 0.041 (2.40) 1.254 (1.30) -0.212 - 0.688 Alog primary schooling VII (panel data using base sample with decade-averaged - 0.05 1 (0.64) - 7.778 (0.67) (0.15) - 0.320 0.395 Inflation tax rate IV taxes and infant mortality 1.016 Investment/ GNP II investment, (4.83) - 0.098 (Public and private cons.)/GDP - 0.007 (1.17) - 0.076 LGNPCAP2 LGNPCAP RHS variable: Aid/GNP Dependent variable: I Regressions showing the impact of aid on consumption, 1971-80, 81-90) a.b Table 5 data % !, % 2 c. 2 2 2 g 5 B h a ,? 3 f’ ,” a “3 $_ Table 1 Growth regressions with polynomial effects of aid and policy Annual growth rate in GDP per capita Sample 56 countries, five periods Ž1974–1977 to 1990–1993. Regression 1.1 1.2 1.3 1.4 1.5 1.6 Aid Aid 2 Aid=policy Policy 2 Budget surplus Inflation Openness Financial depth Ethnic fractionalization Assassinations Ethnic=assassination Institutional quality Initial GDP per capita Effect of aid at median Degrees of freedom DWH test a Sargan test b sˆ´ =100 0.238 Ž2.28. y0.754 Ž2.31. y0.006 Ž0.22. 0.0002 Ž0.26. 0.096 Ž2.36. y0.013 Ž2.22. 0.016 Ž2.67. 0.010 Ž0.54. 0.002 Ž0.18. y0.454 Ž1.98. 0.911 Ž2.15. 0.811 Ž4.57. 0.001 Ž0.13. 0.289 Ž2.31. 211 0.22 0.47 3.0 0.241 Ž2.34. y0.763 Ž2.38. 0.044 Ž1.08. 0.262 Ž2.56. y0.570 Ž2.02. 0.052 Ž1.26. 0.002 Ž2.22. 0.114 Ž2.63. y0.016 Ž2.44. 0.015 Ž2.62. 0.012 Ž0.62. 0.002 Ž0.25. y0.458 Ž1.99. 0.899 Ž2.11. 0.836 Ž4.82. 0.001 Ž0.10. 0.287 Ž2.37. 206 0.15 0.87 2.97 0.274 Ž2.64. y0.699 Ž2.52. 0.134 Ž2.49. a y0.004 Ž0.15. 0.091 Ž2.49. y0.011 Ž2.30. 0.017 Ž3.36. 0.010 Ž0.55. 0.001 Ž0.12. y0.460 Ž2.02. 0.919 Ž2.17. 0.810 Ž4.57. 0.001 Ž0.14. 0.291 Ž2.37. 213 0.11 0.65 2.99 0.077 Ž1.89. y0.013 Ž2.86. 0.019 Ž3.66. 0.018 Ž1.12. y0.002 Ž0.21. y0.418 Ž1.86. 0.775 Ž1.89. 0.676 Ž4.26. y0.002 Ž0.33. 0.045 Ž1.14. 213 0.3 0.1 2.97 0.097 Ž2.22. 0.103 Ž2.56. y0.007 Ž1.46. 0.018 Ž3.56. 0.010 Ž0.50. 0.003 Ž0.33. y0.485 Ž2.16. 0.959 Ž2.30. 0.824 Ž4.60. 0.002 Ž0.26. 0.320 Ž2.64. 208 0.05 0.75 2.99 0.081 Ž1.95. y0.015 Ž2.35. 0.025 Ž5.10. 0.018 Ž0.98. y0.001 Ž0.12. y0.427 Ž1.89. 0.783 Ž1.87. 0.762 Ž4.66. y0.001 Ž0.19. 0.110 Ž2.24. 208 0.14 0.38 2.95 551 The p-value of the Durbin–Wu–Hausman test for equality of the OLS and the IV estimates. The p-value of Sargan’s test for overidentifying restrictions. Heteroskedasticity-consistent t-values in parenthesis. Time dummies and dummies for Sub-Saharan Africa and East Asia are included in all regressions. Regressions Ž1.4., Ž1.5., and Ž1.6. exclude five observations as discussed in the main text. The five observations are: Nicaragua Ž1986–1989, 1990–1993., Gambia Ž1986–1989, 1990–1993. and Guyana Ž1990–1993.. Instruments: Dummy for Egypt, Arms imports Ž t y1., Policy Ž t y1., Policy 2 Ž t, t y1., Policy=lnŽpopulation., Policy=Initial GDP per capita, Policy=ŽInitial GDP per capita. 2 , Policy=aid Ž t y1., Policy=aid 2 Ž t y1., aid Ž t y1., aid 2 Ž t y1.. The reduced form partial R 2 measures for the endogenous regressors, Aid, Aid 2 and Aid=policy, are 0.30 Ž0.30., 0.38 Ž0.33., and 0.38 Ž0.39. in regression 1.1 Ž1.4., respectively. b H. Hansen, F. Tarp r Journal of DeÕelopment Economics 64 (2001) 547–570 Dependent variable


