U.C. Berkeley Admissions and Diversity
advertisement
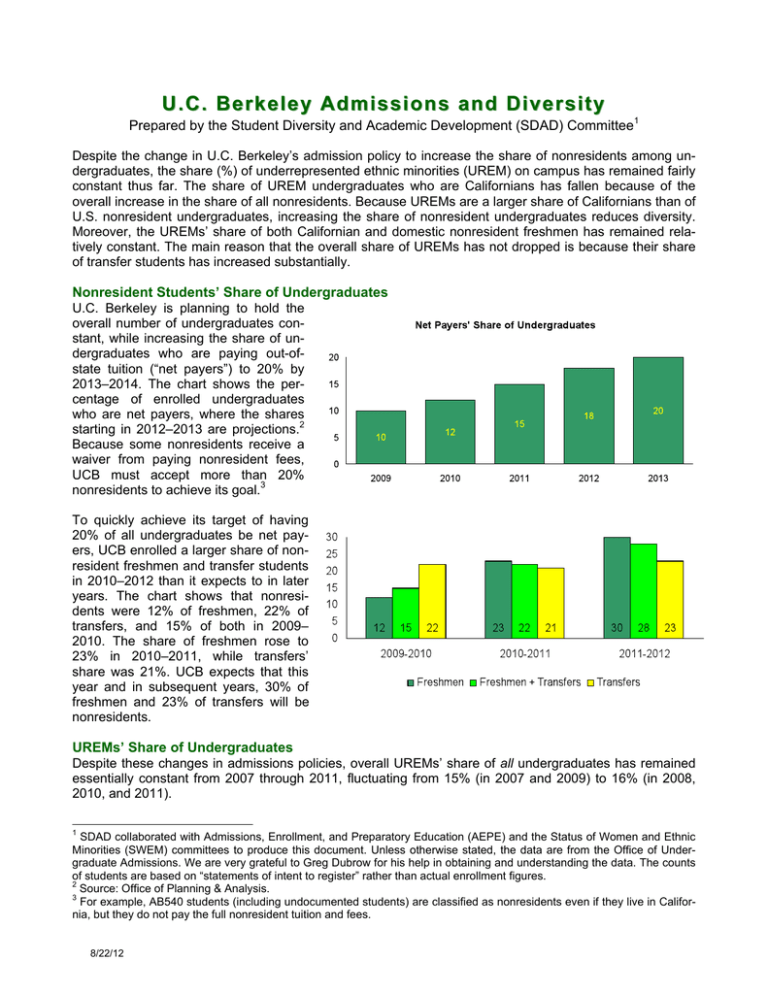
U.C. Berkeley Admissions and Diversity Prepared by the Student Diversity and Academic Development (SDAD) Committee1 Despite the change in U.C. Berkeley’s admission policy to increase the share of nonresidents among undergraduates, the share (%) of underrepresented ethnic minorities (UREM) on campus has remained fairly constant thus far. The share of UREM undergraduates who are Californians has fallen because of the overall increase in the share of all nonresidents. Because UREMs are a larger share of Californians than of U.S. nonresident undergraduates, increasing the share of nonresident undergraduates reduces diversity. Moreover, the UREMs’ share of both Californian and domestic nonresident freshmen has remained relatively constant. The main reason that the overall share of UREMs has not dropped is because their share of transfer students has increased substantially. Nonresident Students’ Share of Undergraduates U.C. Berkeley is planning to hold the overall number of undergraduates constant, while increasing the share of undergraduates who are paying out-ofstate tuition (“net payers”) to 20% by 2013–2014. The chart shows the percentage of enrolled undergraduates who are net payers, where the shares starting in 2012–2013 are projections.2 Because some nonresidents receive a waiver from paying nonresident fees, UCB must accept more than 20% nonresidents to achieve its goal.3 To quickly achieve its target of having 20% of all undergraduates be net payers, UCB enrolled a larger share of nonresident freshmen and transfer students in 2010–2012 than it expects to in later years. The chart shows that nonresidents were 12% of freshmen, 22% of transfers, and 15% of both in 2009– 2010. The share of freshmen rose to 23% in 2010–2011, while transfers’ share was 21%. UCB expects that this year and in subsequent years, 30% of freshmen and 23% of transfers will be nonresidents. UREMs’ Share of Undergraduates Despite these changes in admissions policies, overall UREMs’ share of all undergraduates has remained essentially constant from 2007 through 2011, fluctuating from 15% (in 2007 and 2009) to 16% (in 2008, 2010, and 2011). 1 SDAD collaborated with Admissions, Enrollment, and Preparatory Education (AEPE) and the Status of Women and Ethnic Minorities (SWEM) committees to produce this document. Unless otherwise stated, the data are from the Office of Undergraduate Admissions. We are very grateful to Greg Dubrow for his help in obtaining and understanding the data. The counts of students are based on “statements of intent to register” rather than actual enrollment figures. 2 Source: Office of Planning & Analysis. 3 For example, AB540 students (including undocumented students) are classified as nonresidents even if they live in California, but they do not pay the full nonresident tuition and fees. 8/22/12 UREMs’ Share of Entering Undergraduates The table shows UREMs’ share of all Share of Entering Students (%) 2009 2010 2011 HS entering students (freshmen and transAll UREMs 16.1 17.2 16.9 49.3 fers). The last column shows the American Indians/Alaskan Natives 0.5 0.8 0.8 0.8 shares of UREMs among Californian 4 African Americans 3.0 3.4 3.3 6.9 high school graduates in 2009. Thus, Chicano-Latino 12.6 13.1 12.8 41.6 the share of African Americans among 31.1 30.4 28.6 UCB entering students is about half First Generation that among Californian high school students. Similarly, the UCB share of Chicano-Latino is less than a third of their high school share. The last row of the table shows that the share of first generation students (neither parent has a bachelor’s degree) is falling. Californians’ Share of Freshmen UREMs The share of freshmen UREMs who Californians’ Share (%) are Californians is falling. All UREMs American Indians/Alaskan Natives African Americans Chicano-Latino UREMs’ Shares of Californian and of Domestic Nonresident Freshmen UREMs’ share of freshmen is greater UREMs’ Shares (%) for Californians than for domestic non- Californians residents. African Americans were American Indians/Alaskan Native 3.3% of California freshmen in 2011, African Americans which was more than double their Chicano-Latino share for domestic nonresidents. Simi- Domestic Nonresidents larly, Chicano-Latinos’ share of Califor- American Indians/Alaskan Native nians was more than triple that of doAfrican Americans mestic nonresidents. Chicano-Latino 2008 97 96 98 97 2009 96 100 96 97 2010 93 86 90 94 2011 92 87 90 93 2008 2009 2010 2011 0.5 3.6 12.8 0.5 2.7 12.1 0.8 3.3 13.4 0.9 3.3 14.2 0.3 0.8 5.6 0.0 2.3 7.5 0.7 2.2 4.9 0.5 1.4 4.0 UREMs’ Share of Transfer Students Given that UREMs are a smaller share of nonresidents than of Californians and relatively more nonresidents are being admitted, why has the UREMs’ share of all undergraduates remained relatively constant? The main reason is that the share of UREM Californians has risen. Over the last three years, the UREMs’ share of freshmen remained relatively constant. The share of American Indians/Alaskan Natives was between 0.5% and 0.8%, the share of African Americans was between 2.7% and 3.4%, and the share of Chicano-Latinos was between 12% and 13%. However as the figure shows, the share of UREMs among transfer students rose substantially over the same period. Thus, continued emphasis on UREM outreach programs, particularly those directed at Californian freshmen and especially transfer students, may be increasingly critical to promote the diversity of undergraduates on campus. 4 Source: www.cpec.ca.gov/StudentData/CACGREthnicity.asp 8/22/12 2

