Experiment 9: Magnetism/The Oscilloscope
advertisement
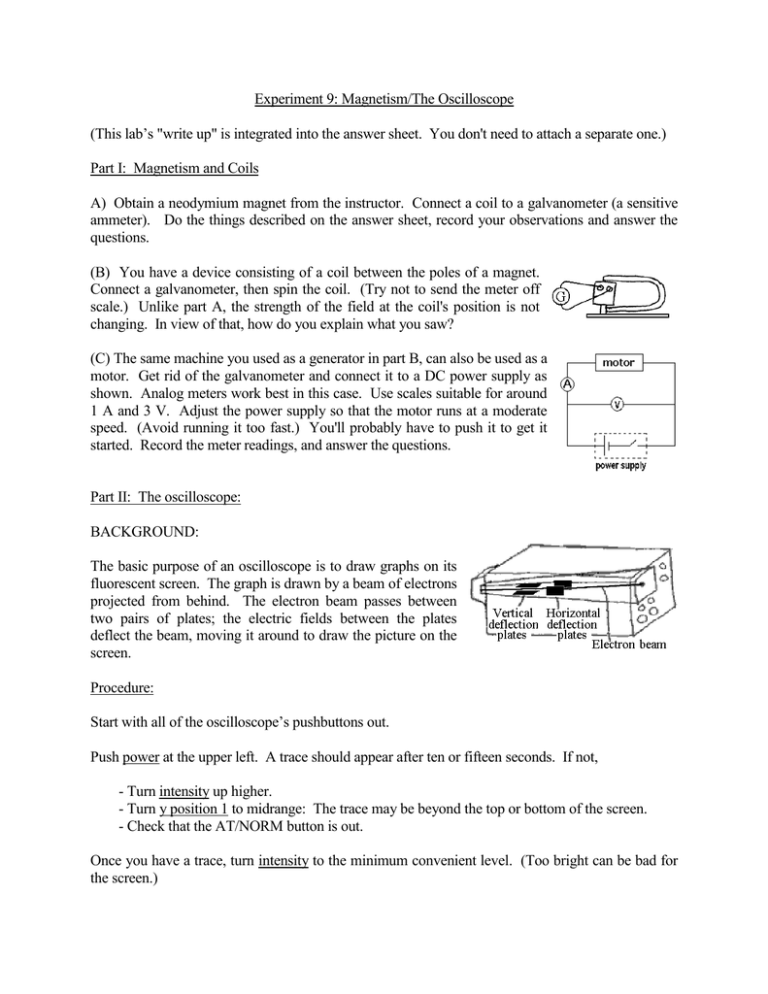
Experiment 9: Magnetism/The Oscilloscope (This lab’s "write up" is integrated into the answer sheet. You don't need to attach a separate one.) Part I: Magnetism and Coils A) Obtain a neodymium magnet from the instructor. Connect a coil to a galvanometer (a sensitive ammeter). Do the things described on the answer sheet, record your observations and answer the questions. (B) You have a device consisting of a coil between the poles of a magnet. Connect a galvanometer, then spin the coil. (Try not to send the meter off scale.) Unlike part A, the strength of the field at the coil's position is not changing. In view of that, how do you explain what you saw? (C) The same machine you used as a generator in part B, can also be used as a motor. Get rid of the galvanometer and connect it to a DC power supply as shown. Analog meters work best in this case. Use scales suitable for around 1 A and 3 V. Adjust the power supply so that the motor runs at a moderate speed. (Avoid running it too fast.) You'll probably have to push it to get it started. Record the meter readings, and answer the questions. Part II: The oscilloscope: BACKGROUND: The basic purpose of an oscilloscope is to draw graphs on its fluorescent screen. The graph is drawn by a beam of electrons projected from behind. The electron beam passes between two pairs of plates; the electric fields between the plates deflect the beam, moving it around to draw the picture on the screen. Procedure: Start with all of the oscilloscope’s pushbuttons out. Push power at the upper left. A trace should appear after ten or fifteen seconds. If not, - Turn intensity up higher. - Turn y position 1 to midrange: The trace may be beyond the top or bottom of the screen. - Check that the AT/NORM button is out. Once you have a trace, turn intensity to the minimum convenient level. (Too bright can be bad for the screen.) For a better idea of how the scope works, turn timebase fully counterclockwise. This turns down the sweep speed; there should now be an almost stationary spot where the electron beam hits the screen. As you slowly turn timebase clockwise, you should see the spot move faster and faster, the rate it moves being labeled next to the knob. After a certain point, it's going so fast that it just smears out into a line. Adjust focus, x position, and y position 1 if necessary for a sharp, centered picture. Now, put some test signals into the scope: You have a function generator, which produces electronic signals. Run wires from its output to the scope's channel 1 input, red to red and black to black. Also connect a loudspeaker to its output. To read the function generator’s frequency, multiply the setting of its frequency dial by the factor on its frequency multiplier knob. Notice that, depending on the setting of the function knob, it can put out a square wave, the familiar sine wave, or a triangle wave. Attenuation and variable attenuation are coarse and fine adjustments for the amplitude. Set the knobs on the function generator for a sinusoidal vibration, volume at some convenient level, and frequency somewhere in the hundreds of hertz. (Frequency multiplier on 100.) On the oscilloscope, adjust y amplifier 1 and timebase so that the picture is not too stretched out or squashed up, horizontally or vertically. If the picture is running along horizontally instead of standing still, try different positions for the trigger selector. (The triggering circuits are what tell the spot when to begin its trip across the screen. If it starts at the wrong time, the next wave it draws will not be on top of the previous one.) Draw two pictures from the scope to show the difference between loud and soft sounds, with the pitch kept the same. Draw two more to show the difference between high and low pitches, with the loudness kept the same. Don't change any knobs on the scope between pictures. Replace the wires from the function generator with a microphone as shown. Turn the y amplifier all the way clockwise. You should now see a graph of the sound if you sing or hum. To get the strongest signal, hold the microphone right under your nose or against your throat. Measure this sound’s period and frequency: a. Check that the three red knobs with arrows (variable timebase, variable y amplitude channel 1 and variable y amplitude channel 2) are fully counterclockwise. The numbers around the knobs don’t mean anything otherwise, so ALWAYS check this just before taking a reading. b. Determine f and T as in this example. (You do not have to have the knobs set the same as in the example. Rather, for the best possible look at the sound, set the timebase to stretch the wave horizontally as much as you can, and still see at least one complete period.): EXAMPLE. From the display pictured, T = (6.2 cm)(.5 ms/cm) = 3.1 ms The 6.2 cm comes from the screen, as shown. .5 ms/cm is the setting of the timebase knob. (You can use something different.) ms stands for millisecond. f = 1/T = 1/.0031 s = 323 Hz Convert 3.1 ms into .0031 s so f comes out in cycles per second, not cycles per ms. Repeat this for the signal induced in a vibrating wire: The wire should run from a clamp on one side of the table over a pulley on the other side of the table to a weight that keeps it under tension. Connect the free end of the wire directly to input on the oscilloscope, tightening the nut onto it as you did with the microphone. Use a wire with an alligator clip to connect the ground to the other end. Put the two wooden supports 40 cm apart and put the neodymium magnet close to the wire about halfway between them. Pluck the wire and measure the period of the signal. You will probably get the best results with the trig selector on LF. (The signal is an induced voltage due to the wire moving through the magnetic field. This isn’t exactly how an electric guitar pickup works, but it’s pretty similar.) If you feel like playing with it, notice how changing the distance between supports changes the pitch you hear and the period you see on the oscilloscope. Sometimes you want your signal to move the spot horizontally rather than vertically. To do this, press the xy button at the top, disconnecting the scope's sweep generator. Have intensity no higher than necessary - a stationary spot can damage the screen. Connect the signal from the function generator to the channel II input at the lower right. Set the function generator so that its output has a frequency of about 1 Hz. Put attenuation at 0 and variable attenuation around the middle of its range. Notice how the spot now moves horizontally rather than vertically. Two frequencies can be compared by putting one signal into the x input and the other into the y input. A good standard for comparison is commercial alternating current, since its frequency is an accurate 60 Hz. From the AC (yellow) terminals of a gray power supply, run wires to both red and black on channel 1. Start with the power supply’s knob all the way counterclockwise. Leave the function generator on channel 2, and set it for a 60 Hz sine wave. Adjust the amplitudes of both signals and the y amplifier knobs on the scope so that the vertical size of the display roughly equals the horizontal size. If the two frequencies were exactly equal, you would see a stationary circle or ellipse. If they were nearly equal, the circle would seem to rotate. With unrelated frequencies, you just get a mess. Adjust the function generator's frequency until you get it as stationary as you can. How far off is your oscillator, both in hertz, and as a percent of the true frequency? The circle you were looking at is just the simplest of a whole family of curves called Lissajous figures. One of these is formed whenever the two frequencies are exactly in the ratio of two small integers. For example, you got the circle when they were 1 to 1. Adjust the function generator so that its frequency is exactly twice the power supply’s. Sketch the 2:1 Lissajous figure. Also, find and sketch the 3:2 figure. These sketches should show all parts of the figure: As they appear to rotate, sometimes some parts get on top of other parts. For example, if a picture of 1: 1 had been asked for, The scope can also display both signals as sine waves. Put the xy button back out again, then press Dual at the bottom. Notice what happens. Wires can pick up undesired signals, called electrical noise or interference, broadcast by our industrial civilization. (The reason coaxial cables are used for certain purposes is to shield against this. The signal wire in the center is surrounded by a grounded conductor which absorbs interference.) To look at this, put the xy button back out and connect a single wire to the red input of channel 1. Hold the other end in your hand by the bare metal. You and the wire are now acting as an antenna. Determine the signal's frequency. The frequency should suggest a probable source of this electrical noise. If you need another hint, watch the signal as you put your hand on the power cord of something that is turned on. PHY 132 Report on Experiment 9: Magnetism/The Oscilloscope Name _____________________________ Part I: Objective: To perform various demonstrations involving magnetism and induction. Procedure & Results: A) A coil is connected to a galvanometer. The difference between moving the magnet toward the coil along its axis vs. moving it away (keeping all else the same) is The effect of approaching the coil with opposite poles is The effect of approaching the coil with the same pole at different speeds (very quickly vs. barely moving) is (In each blank put "FLUX", "FLUX DENSITY", or "RATE THE FLUX CHANGES".) This last result shows that the induced emf depends on the_________________________, not ________________________ or___________________________ because ______________________ and______________________ depend only on how far away the magnet is, but ______________________ depends on how fast it's moving. B) When a coil is spun in a constant magnetic field, a galvanometer ___________show an induced current. (does/ does not) Faraday's law says there has to be a changing flux for induction to happen. But, the coil stays the same distance from a permanent magnet, so B does not change. The explanation for what I saw is that C) A simple DC motor is connected to a power supply and some meters. While running, V= and I = The power taken in by the motor is The energy it uses in one minute is Part II: Objective: To familiarize the student with the oscilloscope, and to make various measurements as described below: Procedures & Results: First, we used the oscilloscope to look at signals from a function generator. The signals also went to a speaker so we could hear them. The results were loud soft high pitch low pitch Next, we looked at signals from a microphone. Measuring the period and frequency for one of our voices, we obtained: T= f = We did the same thing for the signal induced in a vibrating wire by a magnet: T= f = Next, we connected the function generator to the scope's x input, and a signal at the line frequency (a precise 60 Hz) to the y input. The frequencies must match exactly for the circular display to stay still. In this way, we adjusted the function generator so that its frequency matched the 60 Hz. The reading on its dial was off by _______________Hz, or ______________%. We then adjusted the function generator to other frequencies, obtaining the Lissajous figures shown: 2:1 figure 3:2 figure Finally, we connected a wire to the scope's input, and held the other end, acting as an antenna. The scope showed the following signal: T= f= The source of this is apparently _______________________________.
