ECE 371 SUSTAINABLE ENERGY SYSTEMS EXPERIMENT 6 PHOTOVOLTAIC SOLAR CELL SIMULATION WITH MATLAB
advertisement
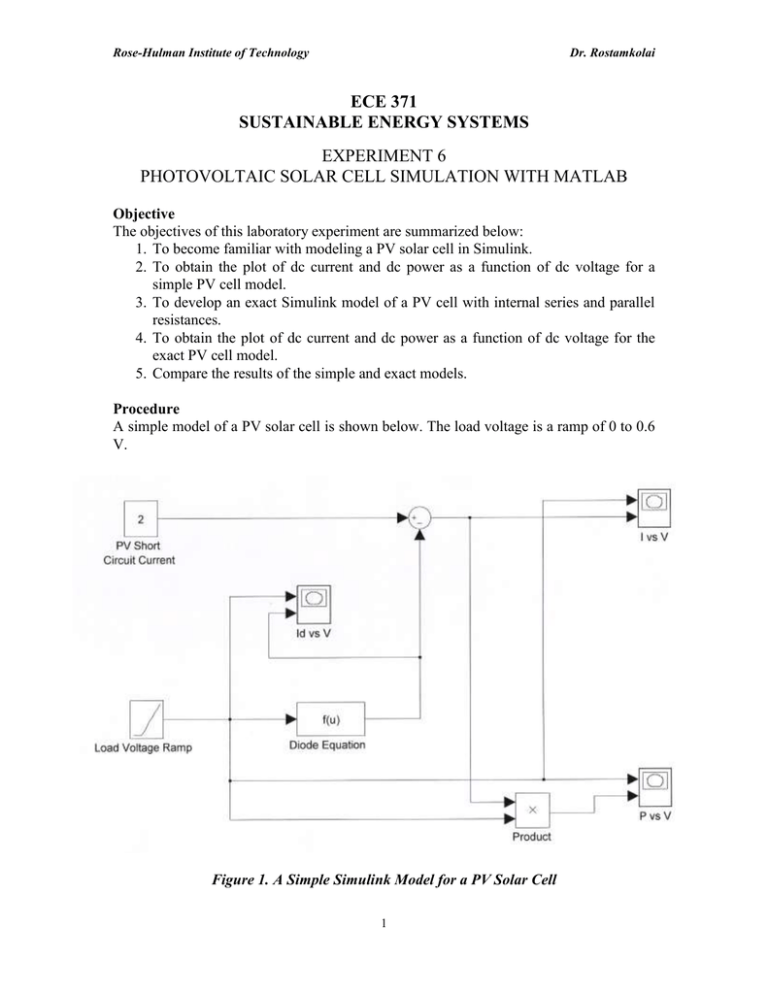
Rose-Hulman Institute of Technology Dr. Rostamkolai ECE 371 SUSTAINABLE ENERGY SYSTEMS EXPERIMENT 6 PHOTOVOLTAIC SOLAR CELL SIMULATION WITH MATLAB Objective The objectives of this laboratory experiment are summarized below: 1. To become familiar with modeling a PV solar cell in Simulink. 2. To obtain the plot of dc current and dc power as a function of dc voltage for a simple PV cell model. 3. To develop an exact Simulink model of a PV cell with internal series and parallel resistances. 4. To obtain the plot of dc current and dc power as a function of dc voltage for the exact PV cell model. 5. Compare the results of the simple and exact models. Procedure A simple model of a PV solar cell is shown below. The load voltage is a ramp of 0 to 0.6 V. Figure 1. A Simple Simulink Model for a PV Solar Cell 1 Rose-Hulman Institute of Technology Dr. Rostamkolai This Simulink model uses a Function model that is found under User-Defined-Models in the Simulink environment. This function should incorporate the diode equation with a reverse saturation current of 1 nA at a room temperature of 25 oC. Part 1 – Building the Model Build the model of Figure 1 in the Simulink environment and choose the following for the simulation Configuration Parameters: - Simulation Start Time of 0.0 second - Simulation Stop Time of 0.6 second - Solver Option Type of “Fixed-Step” and a Solver of “ode3” - Step Size of 0.01 second After performing the simulation, verify that you have produced correct results. Then delete the XY Graphs and write I, V and P in Workspaces. Save this model. Part 2 – Simulation of I-V and P-V for the PV Cell Start with a PV cell short circuit current of 2 A and a voltage ramp of 0 to 0.6 V to perform the Simulink simulation. Plot the dc current I and dc power P as a function of dc voltage V in Matlab. Print the two characteristics (I-V & P-V) as two subplots on one sheet of paper. The x-axis should be your voltage in volts (a range of 0 to 0.6 V produces a nice plot), and y-axis either current in A or power in W. Show the maximum power point on the plots. Part 3 – Exact Model The simple model of the PV solar cell can be modified to obtain a more exact model. The exact model will include the PV solar cell internal series and parallel resistances. Figure 2. An Exact Simulink Model for a PV Solar Cell 2 Rose-Hulman Institute of Technology Dr. Rostamkolai Start with the simple simulink model. Use two new constants, one for the series resistance Rs and the other for parallel resistance Rp. Now replace the “Function” with an “Embedded Matlab Function”. This new function has 4 inputs and 1 output. Program the second and third components of Equation 8.17 in this function: function I1 = fcn(Rs, Rp, V, I) % This block supports an embeddable subset of the MATLAB language. % See the help menu for details. I1 = 1e-9*(exp(38.927*(V+I*Rs))-1)+(V+I*Rs)/Rp; Now use a zero value for Rs, and a very large number for Rp. Perform the Simulink simulation and verify that the results are identical to the results of the simple model. Part 4 – Simulation of I-V and P-V for the Exact PV Cell Model Insert a value of 50 mΩ for Rs and 6 Ω for Rp and perform the Simulink simulation. Plot the dc current I and dc power P as a function of dc voltage V in Matlab. Print the two characteristics (I-V & P-V) as two subplots on one sheet of paper. The x-axis should be your voltage in volts (a range of 0 to 0.6 V produces a nice plot), and y-axis either current in A or power in W. Show the maximum power point on the plots. Part 5 – Comparison of Results Compare the results of Parts 2 and 4. Compare the two I-V characteristics by plotting them on the same graph. Then determine the values of series and parallel resistances (Rs & Rp). Also, compare the two P-V characteristics and determine the reduction in the maximum cell power. Documentation At the end of the lab period, submit this document with your insertions and all of the generated plots. Document your concluding remarks. 3
