Grade 5 Clarifying Lessons: Alphabet Frequency
advertisement
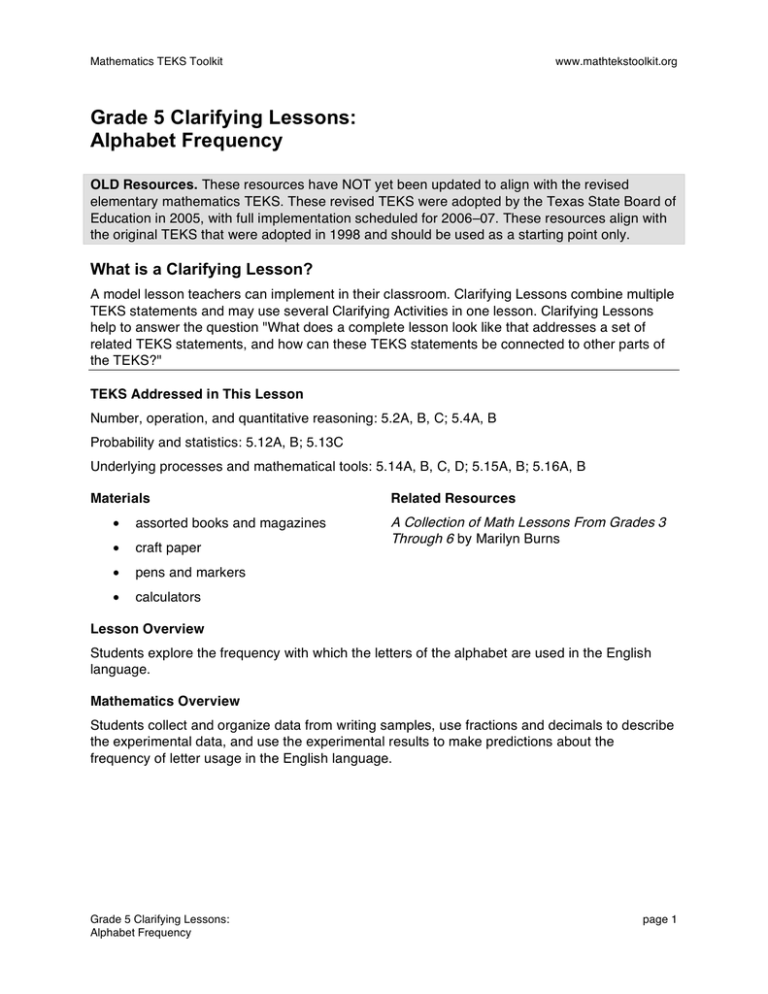
Mathematics TEKS Toolkit www.mathtekstoolkit.org Grade 5 Clarifying Lessons: Alphabet Frequency OLD Resources. These resources have NOT yet been updated to align with the revised elementary mathematics TEKS. These revised TEKS were adopted by the Texas State Board of Education in 2005, with full implementation scheduled for 2006–07. These resources align with the original TEKS that were adopted in 1998 and should be used as a starting point only. What is a Clarifying Lesson? A model lesson teachers can implement in their classroom. Clarifying Lessons combine multiple TEKS statements and may use several Clarifying Activities in one lesson. Clarifying Lessons help to answer the question "What does a complete lesson look like that addresses a set of related TEKS statements, and how can these TEKS statements be connected to other parts of the TEKS?" TEKS Addressed in This Lesson Number, operation, and quantitative reasoning: 5.2A, B, C; 5.4A, B Probability and statistics: 5.12A, B; 5.13C Underlying processes and mathematical tools: 5.14A, B, C, D; 5.15A, B; 5.16A, B Materials • assorted books and magazines • craft paper • pens and markers • calculators Related Resources A Collection of Math Lessons From Grades 3 Through 6 by Marilyn Burns Lesson Overview Students explore the frequency with which the letters of the alphabet are used in the English language. Mathematics Overview Students collect and organize data from writing samples, use fractions and decimals to describe the experimental data, and use the experimental results to make predictions about the frequency of letter usage in the English language. Grade 5 Clarifying Lessons: Alphabet Frequency page 1 Mathematics TEKS Toolkit www.mathtekstoolkit.org Part 1 Set-up (to set the stage and motivate the students to participate) 1. Have students brainstorm situations when it is important to know how frequently letters are used (e.g. designing a game like Scrabble; playing Wheel of Fortune; designing packages of punch-out or rub-off letters; solving cryptograms; and designing keyboards.) (5.14A) 2. Ask students what five letters they think are used most frequently in the English language. Students should then discuss their individual predictions in their groups and prepare a group prediction. 3. Next, have each small group design a plan to test their predictions. Use guiding questions to help each group include in their plan collecting a sample of data (e.g. counting the number of each letter used in a paragraph from the newspaper) and organizing their data into a frequency table or graph. (5.13C; 5.14B, C, D) 4. Have each group use fractions and decimals to describe their data. (5.2A, C; 5.4A, B; 5.12A, B; 5.15A) Teacher Notes (to personalize the lesson for your classroom) Guiding Questions (to engage students in mathematical thinking during the lesson) • What did your group decide to do to test your prediction about the most frequently used letters in the English language? (5.14B, C, D) • Why did you decide to do that? (5.14B, C, D; 5.16B) • Where did you decide to get your sample of data? Why? (5.14C, 5.16B) • How did you decide to record your data? Why? (5.14B, 5.14D, 5.16B) • How did you decide to organize your data? Why? (5.13C, 5.14D, 5.16B) • How can you use fractions to describe your data? (5.2A, B; 5.12A; 5.15A) • How can you use decimals to describe your data? (5.2C; 5.4A, B;5.15A) Teacher Notes (to personalize the lesson for your classroom) Grade 5 Clarifying Lessons: Alphabet Frequency page 2 Mathematics TEKS Toolkit www.mathtekstoolkit.org Summary Questions (to direct students' attention to the key mathematics in the lesson) To encourage students to analyze and evaluate their plans for testing their predictions about letter frequency, ask questions such as: • How did you decide to test your predictions about letter frequency? (5.14B, C, D) • Why did you use the sample of data that you did? (5.14B, 5.16B) • How did you organize your data? (5.13C, 5.14C, D) • What other ways might you have organized it? (5.13C, 5.14C, D) • Why did you decide to organize it the way you did? (5.13C, 5.14C, 5.16B) • What observations can you make from your data organized the way it is? (5.12B, 5.16A) • What observations might you be able to make from it if it were organized another way? (5.12B, 5.16A) • Based on your data, what is the order of the letters according to frequency of use? (5.12B, 5.16A) • Are all the groups' results the same? If not, how are they different? Why do you think they are different? (5.15A) To highlight the use of fractions and decimals to describe the results, ask questions such as: • How can you use a fraction to describe the frequency of the use of the letter n based on your data? (5.12A; 5.15A, B) • How can you use that fraction to compare your results to someone else's results? (5.2A, B) • How can you use a decimal to describe the frequency of the use of the letter n based on your data? (5.2C; 5.4A, B; 5.15A, B) • How can you use that decimal to compare your results to someone else's results? (5.2C; 5.4A, B) Teacher Notes (to personalize the lesson for your classroom) Grade 5 Clarifying Lessons: Alphabet Frequency page 3 Mathematics TEKS Toolkit www.mathtekstoolkit.org Part 2 Set-up (to set the stage and motivate the students to participate) 1. Have students discuss why they think the lists of frequencies determined by each group are not exactly the same. Discuss the use of larger samples upon which to base decisions. 2. Have students enter each group's totals into a class chart (on craft paper). For example, a b c d e f … z Group 1 Group 2 … Group n Totals Use three different colors of markers (for instance red, green, and black), alternating colors (red, green, black, red green, black, etc.) for the letters in the headings of the chart. Ask students to record their totals in the same color that the letter it pertains to is written in. (This makes the chart much easier to read from a distance.) (5.14C) 3. To avoid traffic jams, ask half of the groups to start at "a" and work towards "z" and half of the groups to start at "z" and work towards "a". (5.14C) 4. As groups finish, assign letters to them so they can find the class totals. Discuss the need for more than one person to do the totals to make sure that they are accurate. (5.14C) 5. After all the totals have been calculated and entered, have students use the data in the chart to identify the letters in order of frequency. (Students may want to reorganize the data to be able to see this more clearly, e.g. enter it into a spreadsheet and make an ordered list or a bar graph.) (5.14D; 5.15A, B) 6. Have students use fractions and decimals to describe the frequency of each letter in the class sample. (5.2A, B, C; 5.4A, B; 5.12A, B; 5.15A, B) 7. Have students compare the class results to their individual group results and to "official" letter frequency lists. (5.15A; 5.16A, B) Teacher Notes (to personalize the lesson for your classroom) Grade 5 Clarifying Lessons: Alphabet Frequency page 4 Mathematics TEKS Toolkit www.mathtekstoolkit.org Guiding Questions (to engage students in mathematical thinking during the lesson) • How can we represent the class data most efficiently? (5.13C; 5.14B, C, D) • How can we organize and represent the class data to see how it compares to the groups' data? (5.13C; 5.14B, C, D; 5.16A) • How can we use the chart to analyze the class data? (5.13C; 5.15A) • How can we use fractions to describe the class data? (5.2A; 5.15A, B) • How can we use decimals to describe the class data? (5.2C; 5.4A, B; 5.15A, B) • How can we use fractions to compare the class data to the groups' data? (5.2B; 5.15A, B) • How can we use decimals to compare the class data to the groups' data? (5.2C; 5.4A, B; 5.15A, B) Teacher Notes (to personalize the lesson for your classroom) Summary Questions (to direct students' attention to the key mathematics in the lesson) To encourage students to analyze the class data about letter frequency, ask questions such as: • What order of letter frequency does the class data indicate? (5.12B, 5.15A) • Which representation of the data makes this easiest to see? (5.13C, 5.15A) • How does this order compare to that shown by each groups' data? (5.15A) • Why do you think the class order is different from some of the group orders? (5.12B, 5.16B) • Which order do you think is the most reliable to use in making predictions? Why? (5.12B, 5.16B) • When taking a survey, how would you decide how many and which people to ask? Why? (5.12B, 5.14A, 5.16B) • How can the way you collect your sample influence your results? (5.14A, B, 5.16B) • What kinds of things in our data collection about letter frequency might have influenced our results? (5.14B, 5.16B) Grade 5 Clarifying Lessons: Alphabet Frequency page 5 Mathematics TEKS Toolkit www.mathtekstoolkit.org To highlight the use of fractions and decimals to describe the results and make predictions, ask questions such as: • How can you use a fraction to describe the frequency of the use of the letter n based on the class data? (5.12A; 5.15A, B) • How can you use fractions to compare the frequency of n based on the class data and the frequency of n based on your group's data? (5.2A, B; 5.15A, B) • How can you use a decimal to describe the frequency of the use of the letter n based on the class data? (5.2C; 5.4A, B; 5.15A, B) • How can you use decimals to compare the frequency of n based on the class data and the frequency of n based on your group's data? (5.2C; 5.4A, B; 5.15A, B) • What is an advantage of reporting the results in the form of fractions and decimals? (You can compare results from different sizes of data samples.) (5.15A, B) • So, in designing a set of 250 rub-on letters, how could you use the fraction descriptions of letter frequency to help you decide how many of each letter to include? (5.12B; 5.14A, B, C, D) Teacher Notes (to personalize the lesson for your classroom) Assessment Task(s) (to identify the mathematics students have learned in the lesson) • Have each student write a report, explaining the process they used for collecting and organizing data and using fractions and decimals to describe their results. • Give students a set of fractions or decimals that describe a hypothetical set of data, and ask them to describe what the data could have looked like. Teacher Notes (to personalize the lesson for your classroom) Extension(s) (to lead students to connect the mathematics learned to other situations, both within and outside the classroom) • Students can make up sentences such as "This is odd. Do you know why? Try to find out. Do you know now?" that do not fit their results of letter frequency. Grade 5 Clarifying Lessons: Alphabet Frequency page 6 Mathematics TEKS Toolkit www.mathtekstoolkit.org • Students can play the "You Can't Say N" game. One person starts to talk, trying not to say any word with the letter n in it. Others in the group listen. When the person talking uses a word with an n, someone else tries. • Students can research the development of the QWERTY keyboard and its relationship to letter frequency. Students can use their results to design a keyboard and justify their design. • Students can investigate the game of Scrabble. They can list the letters in the game in two ways—in order of their values and in order of how many there are of each. Then can then make conclusions about how Scrabble relates to their letter frequency findings and why they do or do not think the Scrabble scoring or the quantity of any letter should be changed. • Students can conduct a letter frequency study for languages other than English and compare their results. • Students can use the class results to solve a cryptogram. Teacher Notes (to personalize the lesson for your classroom) Grade 5 Clarifying Lessons: Alphabet Frequency page 7
