Chapter 3: Interacting Linear Functions, Linear Systems
Chapter 3: Interacting Linear Functions, Linear Systems
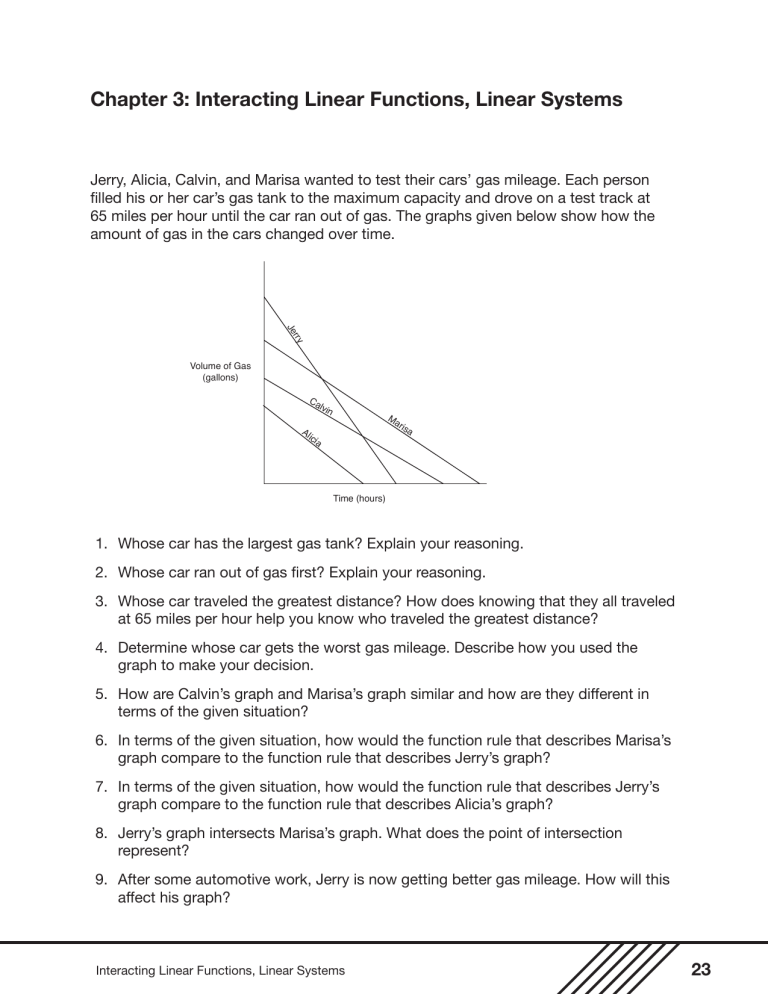
Jerry, Alicia, Calvin, and Marisa wanted to test their cars’ gas mileage. Each person filled his or her car’s gas tank to the maximum capacity and drove on a test track at
65 miles per hour until the car ran out of gas. The graphs given below show how the amount of gas in the cars changed over time.
Volume of Gas
(gallons)
Jerr y
Calvin
A licia
M arisa
Time (hours)
1. Whose car has the largest gas tank? Explain your reasoning.
2. Whose car ran out of gas first? Explain your reasoning.
3. Whose car traveled the greatest distance? How does knowing that they all traveled at 65 miles per hour help you know who traveled the greatest distance?
4. Determine whose car gets the worst gas mileage. Describe how you used the graph to make your decision.
5. How are Calvin’s graph and Marisa’s graph similar and how are they different in terms of the given situation?
6. In terms of the given situation, how would the function rule that describes Marisa’s graph compare to the function rule that describes Jerry’s graph?
7. In terms of the given situation, how would the function rule that describes Jerry’s graph compare to the function rule that describes Alicia’s graph?
8. Jerry’s graph intersects Marisa’s graph. What does the point of intersection represent?
9. After some automotive work, Jerry is now getting better gas mileage. How will this affect his graph?
Interacting Linear Functions, Linear Systems
23
Notes
Materials:
One graphing calculator per student
Algebra TEKS Focus:
(A.6) Linear functions. The student understands the meaning of the slope and intercepts of linear functions and zeros of linear functions and interprets and describes the effects of changes in parameters of linear functions in real-world and mathematical situations.
The student is expected to:
(B) interpret the meaning of slope and intercepts in situations using data, symbolic representations, or graphs;
(A.2) Foundations for functions.
The student uses the properties and attributes of functions.
The student is expected to:
(C) interpret situations in terms of given graphs or creates situations that fit given graphs; and
Additional Algebra TEKS:
(A.1) Foundations for functions. The student understands that a function represents a dependence of one quantity on another and can be described in a variety of ways.
The student is expected to:
Scaffolding Questions:
• Which person’s graph has the greatest y -intercept?
• What does the y -intercept represent in this situation?
•
•
Which person’s graph has the greatest x -intercept?
What does the x -intercept represent in this situation?
•
•
Which lines appear to be parallel?
If two lines are parallel, what will be the same in both of their equations?
• What does the slope of these graphs represent?
Sample Solution:
1. Whose car has the largest gas tank? Explain your reasoning.
The given information states that each person filled his or her tank to capacity. Jerry’s car has the largest tank because at 0 hours his car’s gas tank has the greatest volume.
2. Whose car ran out of gas first? Explain your reasoning.
Alicia’s car ran out of gas first because her car reaches a volume of 0 in the shortest amount of time.
3. Whose car traveled the greatest distance? How does knowing that they all traveled at 65 miles per hour help you know who traveled the greatest distance?
Marisa’s car traveled the farthest because it took her car the longest time to reach a volume of 0. Each person was traveling at 65 miles per hour. Since distance traveled is rate multiplied by time, and Marisa’s time was the greatest, she traveled the greatest distance.
4. Determine whose car gets the worst gas mileage.
Describe how you used the graph to make your decision.
Jerry’s car gets the worst gas mileage. We can tell because his graph has the steepest slope. This means
24
Interacting Linear Functions, Linear Systems
his car’s rate of change is decreasing at the fastest rate.
The absolute value of his rate of change is the greatest.
The rate of change represents the number of gallons used per hour of travel.
5. How are Calvin’s graph and Marisa’s graph similar and how are they different in terms of the given situation?
It appears that the linear graphs for Calvin’s and
Marisa’s cars’ gas mileage are almost parallel, so the slopes would be about the same. That is, the ratio of gallons per hour is approximately the same for both cars. Since the y -intercept of Calvin’s graph is smaller tthan the y -intercept of Marisa’s graph, Calvin’s car has a smaller gas tank, and since Calvin’s graph indicates a volume of zero gallons in less time than Marisa’s graph,
Calvin’s car runs out of gas faster.
6. In terms of the given situation, how would the function rule that describes Marisa’s graph compare to the function rule that describes Jerry’s graph?
The function rules for Marisa’s and Jerry’s cars would be very different. Jerry’s gas tank is larger than Marisa’s, so the function rule (in the form y = mx + b ) that represents his car’s situation would have a greater y -intercept.
Because his car’s graph has a steeper declining slope, his car is using gas at a faster rate; the absolute value of his car’s rate of change is greater.
7. In terms of the given situation, how would the function rule that describes Jerry’s graph compare to the function rule that describes Alicia’s graph?
Jerry’s gas tank holds more than Alicia’s gas tank so the function rule (in the form y = mx + b ) that represents
Jerry’s car’s situation would have a greater y -intercept or b value. Jerry’s car is using gas at a faster rate than
Alicia’s car; therefore, the slope, or m in the function rule, would be negative, with a larger absolute value than the slope in the function rule for Alicia’s car.
8. Jerry’s graph intersects Marisa’s graph. What does the point of intersection represent?
The point of intersection represents the time when
Jerry’s gas tank and Marisa’s gas tank hold the same amount of gas.
(E) interpret and make decisions, predictions, and critical judgments from functional relationships.
(A.5) Linear functions.
The student understands that linear functions can be represented in different ways and translates among their various representations.
The student is expected to:
(C) use, translate, and make connections among algebraic, tabular, graphical, or verbal descriptions of linear functions.
(A.8) Linear Functions.
The student formulates systems of linear equations from problem situations, uses a variety of methods to solve them, and analyze the solutions in terms of the situation.
The student is expected to:
(C) interpret and determine the reasonableness of solutions to systems of linear equations.
Texas Assessment of
Knowledge and Skills:
Objective 1: The student will describe functional relationships in a variety of ways.
Objective 2: The student will demonstrate an understanding of the properties and attributes of functions.
Objective 3: The student will demonstrate an understanding of linear functions.
Interacting Linear Functions, Linear Systems
25
26
9. After some automotive work, Jerry is now getting better gas mileage. How will this affect his graph?
The x -intercept on Jerry’s graph would be a larger number. The slope of his graph would show a more gradual decline.
Extension Questions:
• If a fifth line were added to the graph parallel to, but different from, the line for
Alicia’s car, what would you know about this fifth car?
It uses gasoline at the same rate as Alicia’s car, but it has a different tank capacity.
• Suppose everyone traveled at 55 miles per hour instead of 65 miles per hour.
How would this affect the graphs?
If they were traveling at a slower rate, the amount of gas used per hour would decrease. The graphs would decline at a less steep slope and the x-intercepts would be greater.
• Suppose Calvin’s car’s graph could be represented by the rule y = 30 – 6 x.
What information do you now know about Calvin’s car? When did his car run of gas?
What would be a reasonable rule for Alicia’s travel?
The capacity of his car’s tank is 30 gallons because the y-intercept of y = 30 – 6x is 30. His car is using gasoline at a rate of 6 gallons per hour. At 0 = 30 – 6x, x is 5, so the x-intercept is 5. This means that it takes him 5 hours to run out of gas. If he is traveling at 65 miles per hour, he will have traveled 65 • 5, or 325 miles.
The rules for the other drivers could be estimated using the intercepts.
The y-intercept for the graph of Alicia’s car is about half of that for Jerry’s car, or approximately 15 gallons.
If Jerry’s car’s x-intercept is 5, the x-intercept for the graph for Alicia’s car is about 4.
y = b + mx y = 15 + mx
0 = 15 + 4m m = –3.75
y = 15 – 3.75x would be a possible rule for Alicia’s travel
This function rule would indicate she is using gasoline at a rate of approximately
3.75 gallons per hour.
Interacting Linear Functions, Linear Systems
