Gulf Shores & Orange Beach Tourism
advertisement

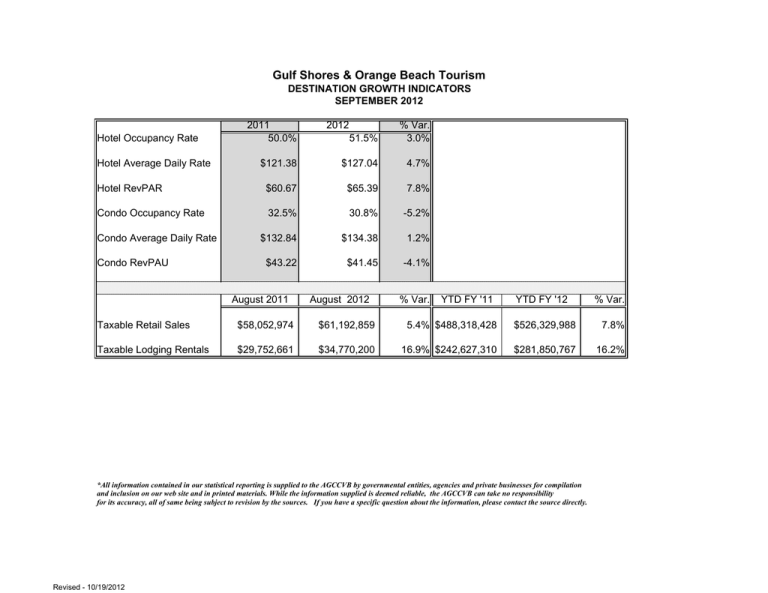
Gulf Shores & Orange Beach Tourism DESTINATION GROWTH INDICATORS SEPTEMBER 2012 51.5% % Var. 3.0% $121.38 $127.04 4.7% Hotel RevPAR $60.67 $65.39 7.8% Condo Occupancy Rate 32.5% 30.8% -5.2% $132.84 $134.38 1.2% $43.22 $41.45 -4.1% Hotel Occupancy Rate Hotel Average Daily Rate Condo Average Daily Rate Condo RevPAU 2011 50.0% August 2011 2012 August 2012 % Var. YTD FY '11 YTD FY '12 % Var. Taxable Retail Sales $58,052,974 $61,192,859 5.4% $488,318,428 $526,329,988 7.8% Taxable Lodging Rentals $29,752,661 $34,770,200 16.9% $242,627,310 $281,850,767 16.2% *All information contained in our statistical reporting is supplied to the AGCCVB by governmental entities, agencies and private businesses for compilation and inclusion on our web site and in printed materials. While the information supplied is deemed reliable, the AGCCVB can take no responsibility for its accuracy, all of same being subject to revision by the sources. If you have a specific question about the information, please contact the source directly. Revised - 10/19/2012 JAN FEB MAR APR MAY JUN JUL AUG SEP OCT NOV DEC ANNUAL Revised - 10/19/2012 NUMBER REP'T. 5 5 6 7 6 7 6 6 5 0 0 0 53 GULF SHORES & ORANGE BEACH TOURISM OCCUPANCY SUMMARY HOTELS/MOTELS 2012 RM.NIT. OCCUPANCY RATES AVERAGE DAILY RATES RENTED TOTAL HIGH LOW TOTAL HIGH LOW 4,426 20.2% 29.1% 7.9% $70.15 $88.22 $55.00 8,183 39.9% 72.5% 18.2% $83.40 $105.95 $68.00 16,482 66.7% 90.0% 46.7% $131.93 $143.77 $112.57 19,262 67.1% 87.2% 53.6% $146.93 $163.53 $110.23 16,697 67.6% 83.3% 56.6% $167.74 $192.13 $117.83 25,312 87.7% 99.7% 71.1% $194.42 $231.81 $129.88 23,341 89.8% 97.5% 79.9% $206.05 $242.35 $155.66 13,898 56.3% 82.1% 35.7% $163.44 $188.00 $109.99 10,192 51.5% 84.5% 34.4% $127.04 $143.00 $95.70 0 0.0% 0.0% 0.0% $0.00 $0.00 $0.00 0 0.0% 0.0% 0.0% $0.00 $0.00 $0.00 0 0 0% 0.0% 0 0% 0.0% 0 0% 0.0% $0 00 $0.00 $0 00 $0.00 $0 00 $0.00 137,793 62.7% 146.3% 47.1% $160.35 $212.48 $121.90 Gulf Shores & Orange Beach Tourism HOTEL OCCUPANCY SUMMARY Gulf Shores & Orange Beach, Alabama Occupancy Rate Revenue per Available Room Average Daily Rate DEC JAN FEB WINTER 2009 18.5% 22.6% 45.7% 28.8% 2010 14.5% 19.3% 41.7% 25.0% 2011 17.4% 23.3% 41.6% 26.4% 2012 16.8% 20.2% 39.9% 25.3% 2009 $82.93 $62.95 $82.27 $77.82 2010 $81.18 $57.49 $75.43 $72.52 2011 $84.16 $73.65 $84.11 $80.83 2012 $86.14 $70.15 $83.40 $80.42 2009 $15.36 $14.25 $37.58 $22.40 2010 $11.78 $11.11 $31.42 $18.11 2011 $14.62 $17.18 $35.01 $21.37 MAR APR MAY SPRING 49.3% 52.3% 65.3% 55.3% 52.7% 58.9% 68.9% 59.8% 59.9% 67.7% 65.3% 64.3% 66.7% 67.1% 67.6% 67.1% $116.45 $132.55 $142.36 $131.12 $117.10 $128.88 $123.04 $123.15 $118.87 $130.69 $149.47 $133.41 $131.93 $146.93 $167.74 $148.84 $57.39 $69.36 $92.98 $72.49 $61.70 $75.87 $84.74 $73.66 $71.22 $88.01 $88.46 $98.58 $97.56 $113.36 $85.72 $99.91 JUN JUL AUG SUMMER 81.6% 80.4% 57.4% 73.1% 63.1% 68.3% 45.2% 59.7% 83.3% 92.1% 59.8% 78.4% 87.7% 89.8% 56.3% 78.6% $165.73 $187.24 $147.76 $168.98 $147.34 $141.05 $121.01 $138.85 $175.02 $194.42 $135.27 $93.00 $145.85 $170.46 $191.40 $206.05 $150.45 $96.40 $176.34 $185.13 $140.17 $163.44 $84.79 $54.75 $83.76 $91.95 $172.56 $0.00 $123.45 $82.86 $135.21 $0.00 SEP OCT NOV FALL 50.4% 43.1% 25.7% 39.7% 56.3% 54.1% 27.3% 45.9% 50.0% 51.5% $110.30 $114.44 $121.38 $127.04 49.9% 0.0% $108.53 $112.24 $117.33 $0.00 23.9% 0.0% $86.96 $91.40 $94.74 $0.00 41.7% 51.5% $104.67 $109.00 $114.97 $0.00 ANNUAL 49.6% 47.8% 53.3% 58.5% $132.73 $118.13 $138.53 Revised - 10/19/2012 $64.43 $55.55 $46.78 $22.33 $41.60 2012 $14.44 $14.17 $33.29 $20.35 $64.41 $60.73 $24.97 $50.04 $60.67 $58.55 $22.67 $47.97 $65.39 $0.00 $0.00 $0.00 $65.82 $56.46 $73.87 $37.69 Gulf Shores & Orange Beach Tourism CONDOMINIUM OCCUPANCY SUMMARY RENTAL MGT. COMPANIES 2012 NUMBER RM.NIT. OCCUPANCY RATES REP'T. RENTED TOTAL HIGH LOW JAN 5 48,030 34.7% 37.0% 31.9% 86 732 63 2% 77 0% 54.6% 54 6% FEB 6 86,732 63.2% 77.0% MAR 6 73,263 52.5% 61.0% 46.0% APR 6 44,326 31.4% 34.9% 25.8% MAY 6 59,180 43.2% 53.4% 31.0% JUN 6 107,938 76.3% 96.4% 51.5% JUL 6 119,530 82.6% 96.9% 74.3% AUG 6 67,551 46.8% 62.6% 33.0% SEP 5 39,370 30.8% 34.9% 15.6% OCT 0 0 0.0% 0.0% 0.0% NOV 0 0 0.0% 0.0% 0.0% DEC 0 0 0.0% 0.0% 0.0% ANNUAL 52 645,920 51.6% 59.4% 43.3% ised - 10/19/2012 AVERAGE DAILY RATES TOTAL HIGH LOW $48.40 $65.00 $36.33 $54 46 $65 00 $40 33 $54.46 $65.00 $40.33 $117.84 $138.00 $61.64 $175.77 $297.00 $116.19 $226.96 $390.00 $141.31 $259.51 $417.00 $195.80 $284.95 $458.00 $200.36 $193.83 $363.00 $137.43 $134.38 $228.00 $87.15 $0.00 $0.00 $0.00 $0.00 $0.00 $0.00 $0.00 $0.00 $0.00 $181.69 $1,465.00 $122.82 Gulf Shores & Orange Beach Tourism CONDOMINIUM OCCUPANCY SUMMARY Gulf Shores & Orange Beach, Alabama DEC JAN FEB WINTER 2009 11.9% 40.3% 65.0% 38.0% MAR APR MAY SPRING 48.5% 32.3% 37.7% 45.4% 51.6% 33.9% 36.5% 40.8% 45.8% 36.5% 45.8% 42.7% 52.5% $87.47 $93.43 $111.16 31.4% $143.67 $134.36 $145.65 43.2% $158.71 $167.62 $182.12 42.3% $125.27 $126.16 $147.27 $117.84 $175.77 $226.96 $168.90 $48.20 $45.55 $61.24 $51.47 $50.86 $53.12 $83.40 $62.88 $61.88 $55.23 $97.95 $71.47 JUN JUL AUG SUMMER 71.8% 79.5% 53.6% 68.7% 44.3% 41.5% 26.7% 37.6% 73.1% 87.8% 48.4% 70.5% 76.3% 82.6% 46.8% 68.5% $259.51 $145.27 $87.36 $284.95 $171.34 $76.33 $193.83 $79.87 $33.46 $254.78 $133.59 $66.03 $175.30 $222.64 $84.85 $163.42 $198.04 $235.37 $90.65 $174.56 SEP OCT NOV FALL 34.7% 31.6% 15.8% 28.0% 30.7% 34.6% 18.0% 28.4% 32.5% 30.8% $107.30 $105.19 $132.84 $134.38 31.5% 0.0% $91.30 $94.89 $116.61 $0.00 15.9% 0.0% $77.04 $70.88 $79.17 $0.00 26.3% 30.8% $95.93 $94.71 $115.05 $134.38 $32.26 $32.87 $12.74 $26.89 $43.22 $36.69 $12.59 $30.21 $41.45 $0.00 $0.00 $41.45 ANNUAL 44.0% 37.5% 44.7% 46.8% $131.38 $111.76 $158.47 $178.93 $57.77 $41.89 $70.85 $83.73 Revised - 10/19/2012 2009 $58.80 $39.31 $48.93 $46.53 $202.21 $215.60 $148.90 $194.40 Average Daily Rate 2010 2011 2012 $65.12 $63.66 $74.98 $40.17 $43.64 $48.40 $52.30 $53.11 $54.46 $49.33 $50.94 $54.86 Revenue per Available Unit 2009 2010 2011 2012 $7.00 $8.26 $9.51 $7.78 $15.83 $18.85 $19.12 $16.78 $31.78 $37.64 $30.91 $34.43 $17.70 $21.03 $19.73 $18.90 Occupancy Rate 2010 2011 2012 12.7% 14.9% 10.4% 46.9% 43.8% 34.7% 72.0% 58.2% 63.2% 42.6% 38.7% 34.4% $197.33 $183.78 $125.11 $175.50 $239.88 $253.52 $175.43 $231.92 $42.42 $46.36 $59.78 $49.53 $37.27 $28.85 $12.20 $26.86 3 Month Occupancy Rate - 2012 Based on actual reservations made by: October 1 November December Condos 2012 2012 A 10.9% 6.2% B 11.7% 7.4% C 11.0% 15.0% D 6.0% 7.0% E 12.0% 8.0% F Average 9.5% 20.3% January 2013 26.2% 31.9% 35.0% 30.0% 36.0% November December 2012 2012 62.0% 2.7% 5.1% 1.1% 1.5% 1.5% 7.0% 1.0% January 2013 3.0% 0.4% 8.5% 1.0% Hotels A B C D E F Average 10.2% Revised: 10/19/2012 2.4% 31.8% 3.2% 3 Month Occupancy Rate Forecast 2012 Forecast made by management in: October 1 Condos A B C D E F Average Hotels A B C D E F Average November 2011 2012 ▲/▼ 18.5% 18.0% -0.5 14.0% 14.5% 0.5 5.8% 15.0% 9.2 10.0% 8.0% -2 17.0% 17.0% 0 13.1% 2011 36.1% 15.3% 10.7% 20.7% 14.5% December ▲/▼ 2011 2012 12.4% 12.0% -0.4 7.0% 8.0% 1 12.2% 20.0% 8 8.0% 8.0% 0 9.0% 10.0% 1 1.4 9.7% November 2012 ▲/▼ 60.0% 23.9 15.4% .1 10.5% -0.2 2011 34.1% 14.1% 11.3% 28.6% 7.9 1.9 34.8% December ▲/▼ 2012 40.0% 5.9 14.8% 0.7 12.0% .7 2012 29.1% 14.4% 22.5% 19.8% 11.6% 2012 32.6% 31.9% 36.5% 37.0% 36.0% 22.3% 2.4 22.0% January ▲/▼ 2013 33.0% .4 40.0% 8.1 40.0% 3.5 35.0% -2 45.0% 9 38.6% 3.8 January ▲/▼ 2013 50.0% 20.9 9.2% -5.2 23.0% .5 27.4% 5.4 Gulf Shores & Orange Beach Tourism TAXABLE RETAIL SALES Gulf Shores, Orange Beach, Ft. Morgan Source: Cities' Revenue Department 2009 VAR. $29,132,478 -11.2% $23,396,042 -17.2% $30,931,261 0.7% $83,459,781 -9.1% DEC JAN FEB WINTER 2010 VAR. $25,065,550 -14.0% $23,489,081 0.4% $28,016,166 -9.4% $76,570,797 -8.3% MAR APR MAY SPRING $43,316,033 -15.8% $45,557,328 $47,526,004 -4.5% $47,910,051 $53,572,556 -3.9% $51,265,138 $144,414,593 -8.0% $144,732,517 JUN JUL AUG SUMMER $75,908,166 $86,278,167 $52,839,963 $215,026,297 $215 026 297 SEP OCT NOV FALL ANNUAL 1.7% $58,899,681 7.5% $58,134,589 -4.5% $38,756,430 2.3% $155,790,701 2 3% $155 790 701 $35,993,890 -1.1% $33,253,424 -11.2% $24,694,902 -12.0% $93,942,217 -7.8% $536,842,889 Revised - 10/8/2012 $35,502,120 $36,230,725 $26,893,508 $98,626,353 2011 $27,566,472 $25,179,841 $32,756,282 $85,502,594 2012 $30,192,550 $27,715,128 $38,133,707 $96,041,385 VAR. 9.5% 10.1% 16.4% 12.3% 5.2% $48,962,687 0.8% $57,355,084 -4.3% $61,434,399 0.2% $167,752,171 7.5% $59,379,461 19.7% $60,479,989 19.8% $65,566,031 15.9% $185,425,481 21.3% 5.4% 6.7% 10.5% -22.4% $82,248,451 -32.6% $94,762,238 -26.7% $58,052,974 -27.5% $235,063,663 27 5% $235 063 663 39.6% $86,889,213 63.0% $96,781,050 49.8% $61,192,859 50.9% $244,863,122 50 9% $244 863 122 5.6% 2.1% 5.4% 4.2% 4 2% 9.1% 10.4% 14.3% 11.0% $0 $0 $0 $0 0.0% 0.0% 0.0% 0.0% 25.7% $526,329,988 7.8% -1.4% $38,743,628 9.0% $39,983,894 8.9% $30,748,364 5.0% $109,475,886 -4.3% $475,720,367 -11.4% $597,794,314 VAR. 10.0% 7.2% 16.9% 11.7% Gulf Shores & Orange Beach Tourism TAXABLE RETAIL SALES Foley, Alabama Source: City of Foley DEC JAN FEB WINTER 2009 VAR. $44,778,704 -15.7% $32,690,010 -9.5% $33,877,521 -12.0% $111,346,234 -12.9% 2010 $43,729,874 $32,091,886 $36,072,294 $111,894,054 VAR. -2.3% -1.8% 6.5% 0.5% 2011 VAR. $49,473,208 13.1% $34,123,960 6.3% $38,271,591 6.1% $121,868,758 8.9% 2012 $49,812,081 $35,358,926 $40,941,902 $126,112,909 VAR. 0.7% 3.6% 7.0% 3.5% MAR APR MAY SPRING $45,290,610 -6.9% $42,868,058 -13.6% $43,920,784 -9.2% $132,079,451 -9.9% $48,851,141 $43,718,898 $42,279,721 $134,849,760 7.9% 2.0% -3.7% 2.1% $49,139,542 0.6% $47,528,102 12.4% $44,180,339 4.5% $140,847,983 4.4% $52,522,021 6.9% $47,383,018 -0.3% $49,171,248 11.3% $149,076,286 5.8% JUN $51,372,307 -5.8% JUL $52,359,722 0.3% AUG $39,917,269 -10.5% 10.5% SUMMER $143,649,297 -5.1% $51,478,946 $47,924,876 $39,201,895 $138,605,717 0.2% -8.5% 1.8% -1.8% -3.5% $57,150,777 $56,792,327 $45,208,157 $159,151,261 11.0% 18.5% 15.3% 14.8% $58,900,025 $59,178,568 $48,039,620 $166,118,213 3.1% 4.2% 6.3% 4.4% SEP OCT NOV FALL $40,160,431 $37,907,147 $39,794,022 $117,861,599 6.3% -1.0% 0.9% 2.0% $41,615,863 $41,063,632 $42,920,696 $125,600,191 3.6% 8.3% 7.9% 6.6% $41,971,271 $42,549,704 $42,198,463 $126,719,438 0.9% 3.6% -1.7% 0.9% $0 $0 $0 $0 0.0% 0.0% 0.0% 0.0% ANNUAL $504,936,580 -6.7% $510,949,720 1.2% $548,587,439 7.4% $441,307,407 4.6% Gulf Shores & Orange Beach Tourism TAXABLE LODGING RENTALS Fort Morgan, Gulf Shores, Orange Beach, Alabama Source: Alabama Department of Revenue DEC JAN FEB WINTER 2009 VAR. $4,328,753 9.6% $5,810,568 1.8% $9,094,171 -1.2% $19,233,491 1.9% 2010 VAR. $3,901,977 -9.9% $6,303,559 8.5% $9,548,339 5.0% $19,753,875 2.7% 2011 $4,342,984 $6,593,491 $9,937,245 $20,873,720 VAR. 11.3% 4.6% 4.1% 5.7% 2012 VAR. $4,018,948 -7.5% $7,249,183 9.9% $10,943,470 10.1% $22,211,601 6.4% MAR APR MAY SPRING $14,187,842 -19.7% $16,804,541 15.0% $22,064,192 -8.5% $53,056,575 -5.9% $16,195,347 $17,753,786 $21,113,672 $55,062,804 14.1% 5.6% -4.3% 3.8% $18,126,754 $19,900,757 $27,920,323 $65,947,834 11.9% 12.1% 32.2% 19.8% $22,738,841 $23,259,797 $32,998,642 $78,997,279 -37.0% -51.7% -52.7% -46.8% JUN JUL AUG SUMMER SEP OCT NOV FALL ANNUAL Revised - 10/15/2012 25.4% 16.9% 18.2% 19.8% $46,787,497 $56,538,669 $29,986,464 $133,312,630 -3.3% 1.8% 10.9% 1.8% $29,467,373 $27,304,527 $14,191,001 $70,962,900 $15,049,341 $10,883,962 $5,135,936 $31,069,238 32.3% -0.5% 8.0% 14.8% $12,254,631 -18.6% $11,834,876 8.7% $5,657,786 10.2% $29,747,293 -4.3% $16,543,715 $14,534,963 $6,551,275 $37,629,952 35.0% 22.8% 15.8% 26.5% 1.4% $175,526,871 -25.8% $280,257,261 59.7% $281,850,767 16.2% $236,671,934 $55,656,867 88.9% $71,143,526 27.8% $70,396,229 157.8% $74,728,162 6.2% $29,752,661 109.7% $34,770,200 16.9% $155,805,757 119.6% $180,641,888 15.9% 0.0% 0.0% 0.0% 0.0% Gulf Shores & Orange Beach Tourism TAXABLE LODGING RENTALS Foley, Alabama Source: City of Foley DEC JAN FEB WINTER 2009 $275,783 $295,409 $275,783 $846,975 VAR. -18.4% -17.5% -42.0% -27.7% 2010 $267,264 $280,635 $362,260 $910,158 VAR. -3.1% -5.0% 31.4% 7.5% 2011 $305,674 $307,588 $403,266 $1,016,528 VAR. 2012 14.4% $305,165 9.6% $418,453 11.3% $469,237 11.7% $1,192,854 VAR. -0.2% 36.0% 16.4% 17.3% MAR APR MAY SPRING $538,033 $427,879 $626,381 $1,592,293 -31.2% $686,456 -32.1% $555,471 -30.1% $767,042 -31.0% $2,008,969 27.6% 29.8% 22.5% 26.2% $778,266 $582,439 $932,160 $2,292,865 13.4% $913,051 4.9% $706,400 21.5% $1,056,748 14.1% $2,676,199 17.3% 21.3% 13.4% 16.7% JUN JUL AUG SUMMER $974,816 -3.3% $1,079,512 10.7% $1,292,582 1.6% $1,256,050 -2.8% $607,279 -13.1% $551,436 -9.2% $2,874,677 -3.5% 3.5% $2,886,998 0.4% $1,084,456 $1,588,455 $589,333 $3,262,244 0.5% $1,335,948 26.5% $1,540,342 6.9% $685,719 13.0% $3,562,009 23.2% -3.0% 16.4% 9.2% SEP OCT NOV FALL $447,144 6.4% $552,770 23.6% $435,114 4.4% $477,849 9.8% $381,834 11.2% $315,824 -17.3% $1,264,091 7.1% $1,346,442 6.5% $406,802 -26.4% $417,118 -12.7% $356,817 13.0% $1,180,736 -12.3% ANNUAL $6,578,036 -13.9% $7,152,567 8.7% $7,752,374 $0 $0 $0 $0 8.4% $7,431,062 0.0% 0.0% 0.0% 0.0% 13.1%


