Document 11665426
advertisement
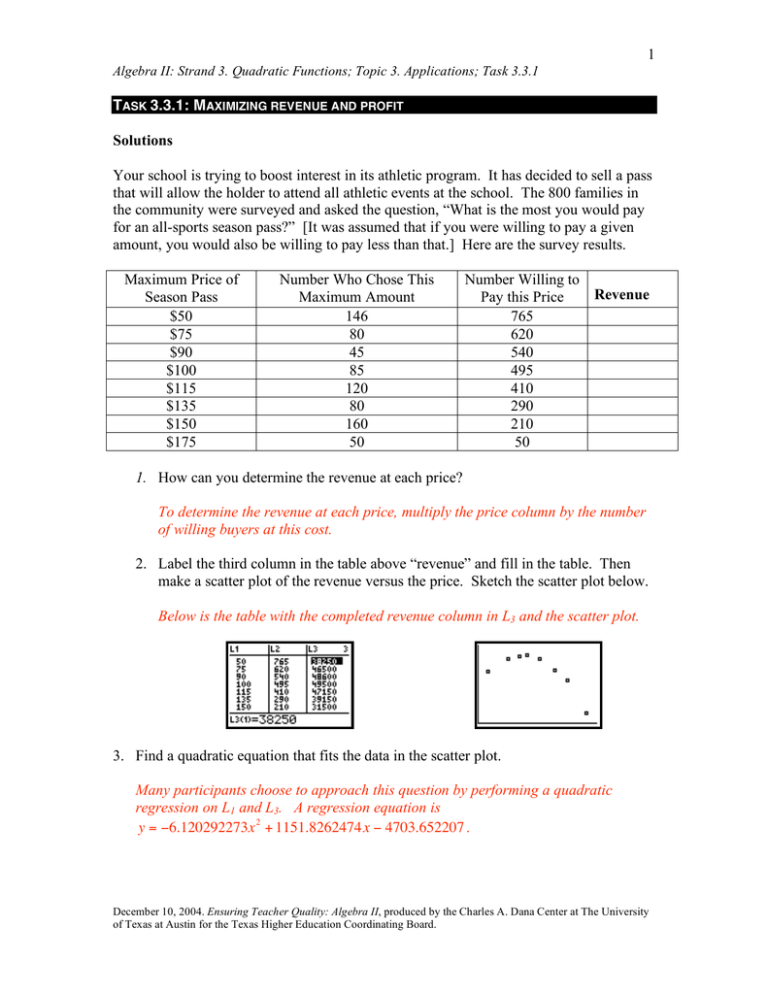
1 Algebra II: Strand 3. Quadratic Functions; Topic 3. Applications; Task 3.3.1 TASK 3.3.1: MAXIMIZING REVENUE AND PROFIT Solutions Your school is trying to boost interest in its athletic program. It has decided to sell a pass that will allow the holder to attend all athletic events at the school. The 800 families in the community were surveyed and asked the question, “What is the most you would pay for an all-sports season pass?” [It was assumed that if you were willing to pay a given amount, you would also be willing to pay less than that.] Here are the survey results. Maximum Price of Season Pass $50 $75 $90 $100 $115 $135 $150 $175 Number Who Chose This Maximum Amount 146 80 45 85 120 80 160 50 Number Willing to Revenue Pay this Price 765 620 540 495 410 290 210 50 1. How can you determine the revenue at each price? To determine the revenue at each price, multiply the price column by the number of willing buyers at this cost. 2. Label the third column in the table above “revenue” and fill in the table. Then make a scatter plot of the revenue versus the price. Sketch the scatter plot below. Below is the table with the completed revenue column in L3 and the scatter plot. 3. Find a quadratic equation that fits the data in the scatter plot. Many participants choose to approach this question by performing a quadratic regression on L1 and L3. A regression equation is y = !6.120292273x 2 + 1151.8262474x ! 4703.652207 . December 10, 2004. Ensuring Teacher Quality: Algebra II, produced by the Charles A. Dana Center at The University of Texas at Austin for the Texas Higher Education Coordinating Board. 2 Algebra II: Strand 3. Quadratic Functions; Topic 3. Applications; Task 3.3.1 Ask participants to consider an alternate method that uses matrices. As a group, go through the Transparency “Using Matrices to Solve a System of Equations”. Use the following questions to guide the discussion. • • • What is the general form of a quadratic equation? y = ax 2 + bx + c What do the data points in L1 and L3 represent in this equation? The values in L1 represent the x-values and the values in L3 represent the y-values. Choose a data point and substitute the values into the general quadratic equation. For example, choose (50, 38250). Then, 38250 = a 50 2 + b ( 50 ) + c . What do we need in order to solve for a, b, and c ? We need three equations like the one above so that we can solve a system of three equations for three unknowns. Choose two other points and set up a system of three equations to solve for the unknowns a, b, and c. For example, choose (100, 49500) and (135, 39150). The system would be: 38250 = a 50 2 + b ( 50 ) + c ( ) • • ( ) 49500 = a (100 ) + b (100 ) + c 39150 = a (135 ) + b (135 ) + c 2 2 • How can the system above be rewritten as a matrix equation? ! 50 2 50 1$ ! a $ ! 38250 $ # & # & # & 2 #100 100 1& ' # b & = # 49500 & #"135 2 135 1&% #" c &% #" 39150 &% Notice in the matrix equation above, we have a 3 by 3 matrix with x-values multiplied by the coefficient matrix to give us the resultant y-value matrix. Remind participants of the row by column matrix multiplication to see that this matrix equation is indeed equivalent to the system of three equations. Next, have participants store the x-value matrix into matrix [A] on their calculators and the y-value matrix into matrix [B] . • The above matrix equation is [A] • [coefficients] = [B]. How can we solve for the coefficient matrix? Multiply both sides of the equation by [A]-1. It is important to remember at this point that matrix multiplication is not commutative. So, we must be precise in our multiplication. The solution is [coefficient] = [A]-1• [B]. This calculation can be performed quickly using a graphing calculator. The quadratic equation is y = !6.126x 2 + 1143.908x ! 3630.252 . This gives the revenue function R(x). December 10, 2004. Ensuring Teacher Quality: Algebra II, produced by the Charles A. Dana Center at The University of Texas at Austin for the Texas Higher Education Coordinating Board. 3 Algebra II: Strand 3. Quadratic Functions; Topic 3. Applications; Task 3.3.1 Other examples: Selecting the points (50, 38250), (135, 39150) and (90, 48600) yields y = !5.5147x 2 + 1030.81x + 496.323 . Selecting the points (100, 49500), (135, 39150) and (150, 31500) yields y = !4.2857x 2 + 711.43x + 21214.285 . Have each group choose a different set of 3 points and use matrices to fit a quadratic function to the data. Compare the results. 4. Find the price of the season pass that produces the maximum revenue. The maximum revenue of $49,770.23 is obtained when the price is $93.36. This can be found by using the maximum feature on a graphing calculator once the equation is found. • How does the maximum found using the calculator feature compare to what you might have guessed the maximum price should have been using only the survey results? Using the survey results, we might have overpriced the season pass. The maximum data point is a price of $100 resulting in a revenue of $49,500 as opposed to the actual maximum revenue of $49,770.23. 5. The cost of the sporting events to the school is also a function of the price of a season pass. Suppose C ( x ) is a cost function such that C ( x ) = !150x + 54, 000 . When will the school make a profit? Describe this in general terms as well as specifically for this situation. The school will make a profit when R(x) > C(x). The intersection points of R(x) and C(x) are called break-even points. The profit function can be written as P(x)=R(x)C(x). • What kind of function is the profit function? It is also a quadratic because it is the result of a quadratic function minus a linear function. The school will make a profit if the price is set between $63.83 and $147.39. Graphically this can be seen by looking at the intersection of the revenue and cost functions. December 10, 2004. Ensuring Teacher Quality: Algebra II, produced by the Charles A. Dana Center at The University of Texas at Austin for the Texas Higher Education Coordinating Board. 4 Algebra II: Strand 3. Quadratic Functions; Topic 3. Applications; Task 3.3.1 Another way to see when the school will make a profit is to look at the graph of P(x) and find where it is above the x-axis. 6. What price would produce the maximum profit for the school? Is this the same price that would produce the maximum revenue? The price that would produce the maximum profit is $105.61. This is not the same as the price that would maximize the revenue. Math notes Many participants choose to approach this question by performing a quadratic regression on L1 and L3. A regression equation is y = !6.120292273x 2 + 1151.8262474x ! 4703.652207 . Ask participants to consider an alternate method that uses matrices. As a group, go through the Transparency “Using Matrices to Solve a System of Equations”. Use the following questions to guide the discussion. • What is the general form of a quadratic equation? • What do the data points in L1 and L3 represent in this equation? • Choose a data point and substitute the values into the general quadratic equation. • What do we need in order to solve for a, b, and c ? December 10, 2004. Ensuring Teacher Quality: Algebra II, produced by the Charles A. Dana Center at The University of Texas at Austin for the Texas Higher Education Coordinating Board. 5 Algebra II: Strand 3. Quadratic Functions; Topic 3. Applications; Task 3.3.1 • Choose two other points and set up a system of three equations to solve for the unknowns a, b, and c. For example, choose (100, 49500) and (135, 39150). The system would be: 38250 = a 50 2 + b ( 50 ) + c ( ) 49500 = a (100 ) + b (100 ) + c 39150 = a (135 ) + b (135 ) + c 2 2 • How can the system above be rewritten as a matrix equation? ! 50 2 50 1$ ! a $ ! 38250 $ # & # & # & 2 #100 100 1& ' # b & = # 49500 & #"135 2 135 1&% #" c &% #" 39150 &% Notice in the matrix equation above, we have a 3 by 3 matrix with x-values multiplied by the coefficient matrix to give us the resultant y-value matrix. Remind participants of the row by column matrix multiplication to see that this matrix equation is indeed equivalent to the system of three equations. Next, have participants store the x-value matrix into matrix [A] on their calculators and the y-value matrix into matrix [B] . The above matrix equation is [A] • [coefficients] = [B]. How can we solve for the coefficient matrix? Use the instructor’s transparency to describe how to solve for the coefficient matrix. Ask each group to choose a different set of 3 points and use matrices to fit a quadratic to the data. Compare the results. Teaching notes In this task, participants look at a quadratic situation and find an equation to fit the data. Go over the scenario given on the activity sheet. Have participants work in groups of 3 – 4 on Exercises 1 – 3. December 10, 2004. Ensuring Teacher Quality: Algebra II, produced by the Charles A. Dana Center at The University of Texas at Austin for the Texas Higher Education Coordinating Board. 6 Algebra II: Strand 3. Quadratic Functions; Topic 3. Applications; Task 3.3.1 TASK 3.3.1: MAXIMIZING REVENUE AND PROFIT Your school is trying to boost interest in its athletic program. It has decided to sell a pass that will allow the holder to attend all athletic events at the school. The 800 families in the community were surveyed and asked the question, “What is the most you would pay for an all-sports season pass?” [It was assumed that if you were willing to pay a given amount, you would also be willing to pay less than that.] Here are the survey results. Maximum Price of Season Pass $50 $75 $90 $100 $115 $135 $150 $175 Number Who Chose This Maximum Amount 146 80 45 85 120 80 160 50 Number Willing to Revenue Pay this Price 765 620 540 495 410 290 210 50 1. How can you determine the revenue at each price? 2. Label the third column in the table above “revenue” and fill in the table. Then make a scatter plot of the revenue versus the price. Sketch the scatter plot below. 3. Find a quadratic equation that fits the data in the scatter plot. 4. Find the price of the season pass that produces the maximum revenue. December 10, 2004. Ensuring Teacher Quality: Algebra II, produced by the Charles A. Dana Center at The University of Texas at Austin for the Texas Higher Education Coordinating Board. 7 Algebra II: Strand 3. Quadratic Functions; Topic 3. Applications; Task 3.3.1 5. The cost of the sporting events to the school is also a function of the price of () () season pass. Suppose C x is a cost function such that C x = !150x + 54, 000 . When will the school make a profit? Describe this in general terms as well as specifically for this situation. 6. What price would produce the maximum profit for the school? Is this the same price that would produce the maximum revenue? December 10, 2004. Ensuring Teacher Quality: Algebra II, produced by the Charles A. Dana Center at The University of Texas at Austin for the Texas Higher Education Coordinating Board. 8 Algebra II: Strand 3. Quadratic Functions; Topic 3. Applications; Task 3.3.1 Instructor’s Transparency Using Matrices to Solve a System of Equations 38250=a(502) + b(50) + c 49500=a(1002) + b(100) + c 39150=a(1352) + b(135) + c ! 502 50 1" # 2 $ Let Matrix A = 100 100 1 # $ #1352 135 1$ % & !38250 " # $ and Matrix B = 49500 # $ #%39150 $& Then the system above can be written as: A• !a " # b $ =B # $ #% c $& To solve for the coefficients: !a " # $ A-1•A• b =A-1•B # $ #% c $& !a " # $ I b # $ #% c $& = A-1•B " a # " !6.126 # $ b % = $ 1143.908 % $ % $ % $& c %' $& !3630.252 %' December 10, 2004. Ensuring Teacher Quality: Algebra II, produced by the Charles A. Dana Center at The University of Texas at Austin for the Texas Higher Education Coordinating Board.
