1 1. Refer to your charts from Task 2.1.1 and... a. A column on the left of the chart...
advertisement
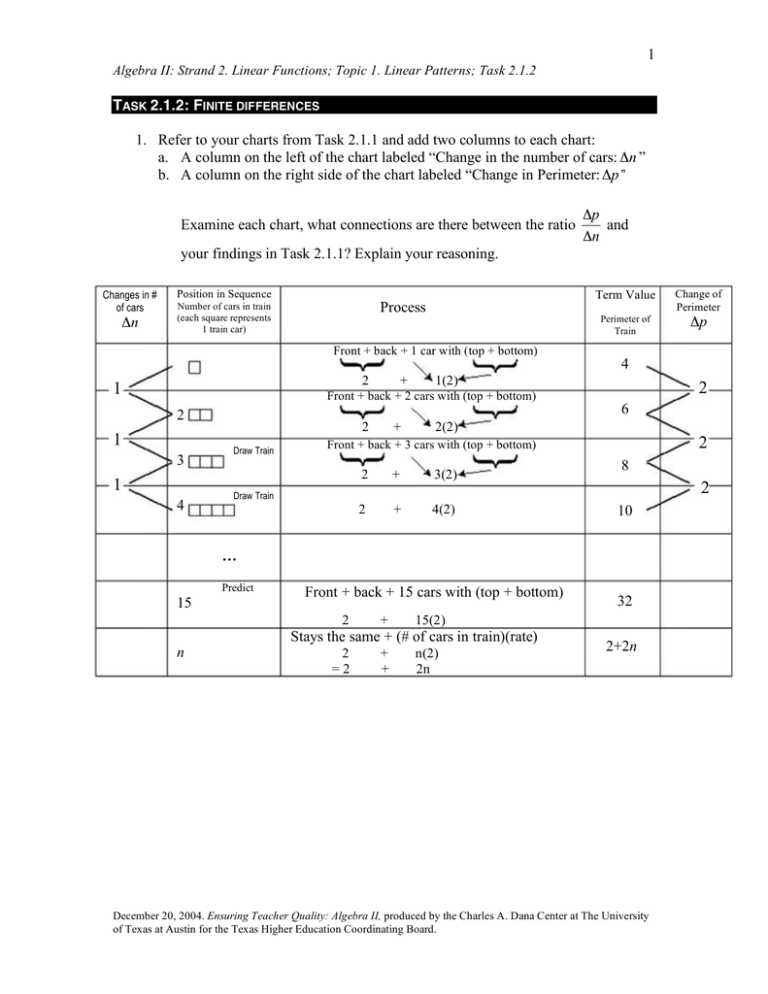
1 Algebra II: Strand 2. Linear Functions; Topic 1. Linear Patterns; Task 2.1.2 TASK 2.1.2: FINITE DIFFERENCES 1. Refer to your charts from Task 2.1.1 and add two columns to each chart: a. A column on the left of the chart labeled “Change in the number of cars: !n ” b. A column on the right side of the chart labeled “Change in Perimeter: !p ” Examine each chart, what connections are there between the ratio your findings in Task 2.1.1? Explain your reasoning. Changes in # of cars !n Position in Sequence Process Number of cars in train (each square represents 1 train car) Front + back + 1 car with (top + bottom) 2 1 + 1 3 1 4 2 Draw Train + Term Value Change of Perimeter Perimeter of Train !p 4 1(2) Front + back + 2 cars with (top + bottom) 2 !p and !n 2 6 2(2) 2 Front + back + 3 cars with (top + bottom) 2 + 3(2) 2 + 4(2) 8 2 Draw Train 10 … Predict 15 Front + back + 15 cars with (top + bottom) 2 n + 15(2) Stays the same + (# of cars in train)(rate) 2 =2 + + 32 n(2) 2n 2+2n December 20, 2004. Ensuring Teacher Quality: Algebra II, produced by the Charles A. Dana Center at The University of Texas at Austin for the Texas Higher Education Coordinating Board. 2 Algebra II: Strand 2. Linear Functions; Topic 1. Linear Patterns; Task 2.1.2 Change in # of cars n Position in Sequence Number of cars in train 1 Front + back + 1 horizontal 2 + 1 3 Front + back + 2 horizontal 2 + 2 4 Draw Train Front + back + 3 horizontal 2 + 3 5 Draw Train Stays the same + (what changes) 2 + (4) 6 1 2 1 3 1 4 Term Value Perimeter of Train Process Change in Perimeter P 1 1 1 ... Predict 2 15 Position Sequence Number of cars in Train !n 17 (15) 2+2n n Changes in # of cars + Term Value Perimeter of Train Process (Front + back) + (bottom with length 2 + top with length 1) · 1 car 1 2 1 + 3 (1) (Front + back) + (3 bottom and top segments) · 2 cars 2 1 2+2n 2 + 3(2) Changes in Perimeter P 5 3 8 Draw Train 2+3(3) 3 1 Draw Train 4 11 3 2+3(4) 14 2+3(15) 47 … 15 n (Front + back) + (3 bottom and top segments) · n cars 2+3n 3 3 2+3n December 20, 2004. Ensuring Teacher Quality: Algebra II, produced by the Charles A. Dana Center at The University of Texas at Austin for the Texas Higher Education Coordinating Board. 3 Algebra II: Strand 2. Linear Functions; Topic 1. Linear Patterns; Task 2.1.2 Change in # of cars Position Sequence Number of cars in train !n (Front + back) + (2 top + 2 bottom) · 1 car 1 2 1 1 3 2 Draw Train 4 (1) + 4 (2) (Front + back) + (2 top + 2 bottom) · 3 cars 2 + 4 (3) (Front + back) + (2 top + 2 bottom) · 4 cars 4 2 … + 4 (4) Change in Perimeter (Front + back) + (2 top + 2 bottom) · 15 cars 2 + n 4 2 + 4n (15) !p 6 4 10 14 4 4 18 Stays the same + rate of change (what changes) Predict 15 + (Front + back) + (2 top + 2 bottom) · 2 cars 2 1 Term Value Perimeter of train Process 62 2 + 4n !p rather than simply comparing !p !n (the rate) for each change in n when determining whether or not there is a linear pattern? Many times finite difference examples are misleading in that they typically illustrate finite differences over intervals of equal length (in most cases length=1 unit). Thus, participants may incorrectly assume that if they were to calculate finite differences for, say, n=1, 3, 4, 7, 9, for a linear function—the change in p would not be constant—that because the finite differences were not constant, the function is not linear. Here we hope to see answers that illustrate that although the !p change in p is not constant they would have to check the ratio before making !n any conclusions. 2. Why is it important to consider the ratio Math notes Investigating finite differences is a typical task for middle school students. The focus of this task is in underscoring the importance of looking at the ratio of the differences rather than only the resulting difference in the function values without regard to the change in the independent variable. Teaching notes This task may be assigned as homework after the instructor illustrates how to expand the charts (adding the extra columns) and demonstrates finding the differences for a few rows. A class discussion should take place at the beginning of the next session where December 20, 2004. Ensuring Teacher Quality: Algebra II, produced by the Charles A. Dana Center at The University of Texas at Austin for the Texas Higher Education Coordinating Board. 4 Algebra II: Strand 2. Linear Functions; Topic 1. Linear Patterns; Task 2.1.2 participants share their results in groups. Ensure that the idea that the graph of any function that produces a constant ratio of finite differences must be a line or that the function must be linear. December 20, 2004. Ensuring Teacher Quality: Algebra II, produced by the Charles A. Dana Center at The University of Texas at Austin for the Texas Higher Education Coordinating Board. 5 Algebra II: Strand 2. Linear Functions; Topic 1. Linear Patterns; Task 2.1.2 TASK 2.1.2: FINITE DIFFERENCES TASK 2.1.2: FINITE DIFFERENCES 1. Refer to your charts from Task 2.1.1 and add two columns to each chart: a. A column on the left of the chart labeled “Change in the number of cars: !n ” b. A column on the right side of the chart labeled “Change in Perimeter: !p ” Examine each chart. What connections are there between the ratio findings in Task 2.1.1? Explain your reasoning. 2. Why is it important to consider the ratio !p !n !p and your !n rather than simply comparing !p (the rate) for each change in n when determining whether or not there is a linear pattern? Explain and give an example that clarifies your explanation. December 20, 2004. Ensuring Teacher Quality: Algebra II, produced by the Charles A. Dana Center at The University of Texas at Austin for the Texas Higher Education Coordinating Board.

