T 1.1.2 : T Solutions
advertisement
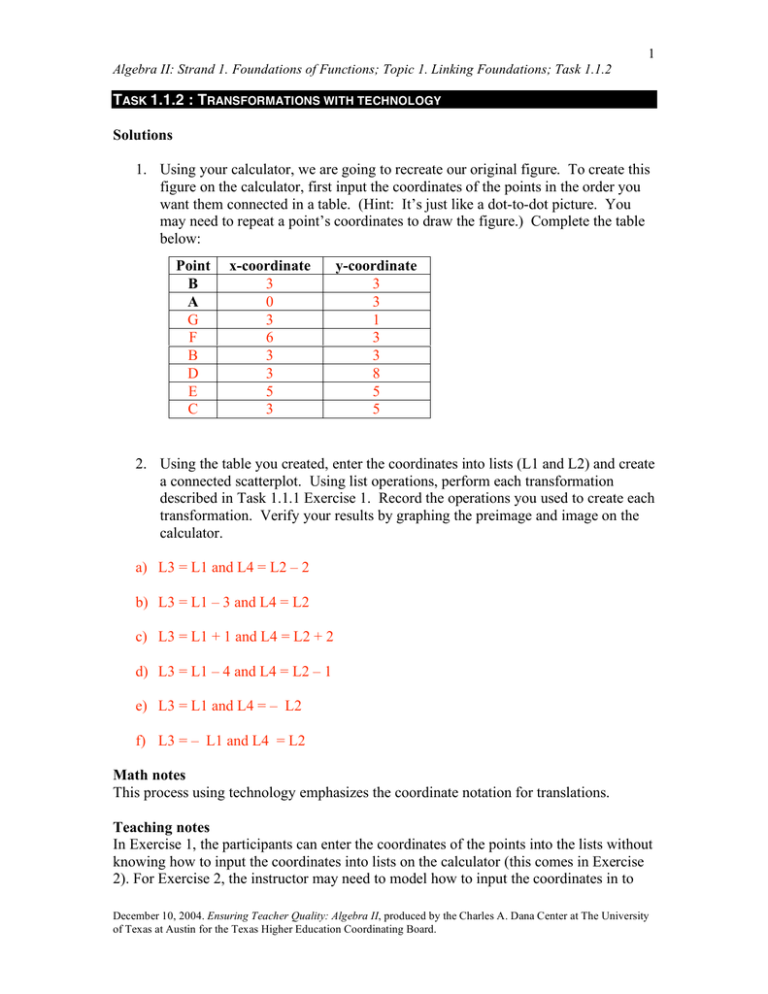
1 Algebra II: Strand 1. Foundations of Functions; Topic 1. Linking Foundations; Task 1.1.2 TASK 1.1.2 : TRANSFORMATIONS WITH TECHNOLOGY Solutions 1. Using your calculator, we are going to recreate our original figure. To create this figure on the calculator, first input the coordinates of the points in the order you want them connected in a table. (Hint: It’s just like a dot-to-dot picture. You may need to repeat a point’s coordinates to draw the figure.) Complete the table below: Point B A G F B D E C x-coordinate 3 0 3 6 3 3 5 3 y-coordinate 3 3 1 3 3 8 5 5 2. Using the table you created, enter the coordinates into lists (L1 and L2) and create a connected scatterplot. Using list operations, perform each transformation described in Task 1.1.1 Exercise 1. Record the operations you used to create each transformation. Verify your results by graphing the preimage and image on the calculator. a) L3 = L1 and L4 = L2 – 2 b) L3 = L1 – 3 and L4 = L2 c) L3 = L1 + 1 and L4 = L2 + 2 d) L3 = L1 – 4 and L4 = L2 – 1 e) L3 = L1 and L4 = – L2 f) L3 = – L1 and L4 = L2 Math notes This process using technology emphasizes the coordinate notation for translations. Teaching notes In Exercise 1, the participants can enter the coordinates of the points into the lists without knowing how to input the coordinates into lists on the calculator (this comes in Exercise 2). For Exercise 2, the instructor may need to model how to input the coordinates in to December 10, 2004. Ensuring Teacher Quality: Algebra II, produced by the Charles A. Dana Center at The University of Texas at Austin for the Texas Higher Education Coordinating Board. 2 Algebra II: Strand 1. Foundations of Functions; Topic 1. Linking Foundations; Task 1.1.2 the calculator lists and also how to use the connected scatterplot to recreate the figure on the calculator. Note that some coordinates will need to be repeated so that the calculator connects the scatterplot in the correct order. In addition, the instructor should model Exercise 2a for the participants because some participants may not have experience in doing list operations on the calculator. Participants will use L3 and L4 to create the transformed figure. (See technology notes). Have participants work in pairs to complete this task make each pair responsible for presenting one of the parts of Exercise 2(2a-2f) and compare results. Technology notes If the instructor is unfamiliar with inputting lists, plotting connected scatterplots, etc. It is crucial that this be reviewed by the instructor prior to working this task . December 10, 2004. Ensuring Teacher Quality: Algebra II, produced by the Charles A. Dana Center at The University of Texas at Austin for the Texas Higher Education Coordinating Board. 3 Algebra II: Strand 1. Foundations of Functions; Topic 1. Linking Foundations; Task 1.1.2 TASK 1.1.2: TRANSFORMATIONS WITH TECHNOLOGY 1. Using your calculator, we are going to recreate our original figure. To create this figure on the calculator, first input the coordinates of the points in the order you want them connected in a table. (Hint: It’s just like a dot-to-dot picture. You may need to repeat a point’s coordinates to draw the figure.) Complete the table below: Point B A x-coordinate y-coordinate 2. Using the table you created, enter the coordinates into lists (L1 and L2) and create a connected scatterplot. Using list operations, perform each transformation described in Task 1.1.1 Exercise 1. Record the operations you used to create each transformation. Verify your results by graphing the preimage and image on the calculator. a. b. c. d. e. f. December 10, 2004. Ensuring Teacher Quality: Algebra II, produced by the Charles A. Dana Center at The University of Texas at Austin for the Texas Higher Education Coordinating Board.
