Measuring host rock volume changes during magma emplacement: Reply Aaron S. Yoshinobu
advertisement
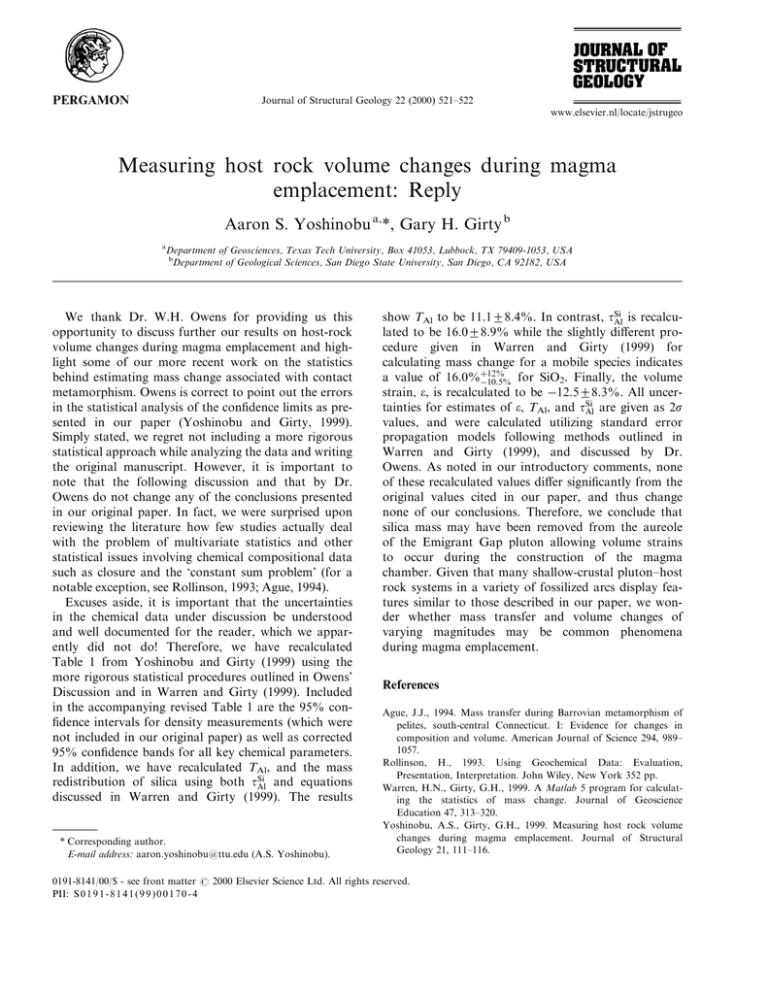
Journal of Structural Geology 22 (2000) 521±522 www.elsevier.nl/locate/jstrugeo Measuring host rock volume changes during magma emplacement: Reply Aaron S. Yoshinobu a,*, Gary H. Girty b a Department of Geosciences, Texas Tech University, Box 41053, Lubbock, TX 79409-1053, USA b Department of Geological Sciences, San Diego State University, San Diego, CA 92182, USA We thank Dr. W.H. Owens for providing us this opportunity to discuss further our results on host-rock volume changes during magma emplacement and highlight some of our more recent work on the statistics behind estimating mass change associated with contact metamorphism. Owens is correct to point out the errors in the statistical analysis of the con®dence limits as presented in our paper (Yoshinobu and Girty, 1999). Simply stated, we regret not including a more rigorous statistical approach while analyzing the data and writing the original manuscript. However, it is important to note that the following discussion and that by Dr. Owens do not change any of the conclusions presented in our original paper. In fact, we were surprised upon reviewing the literature how few studies actually deal with the problem of multivariate statistics and other statistical issues involving chemical compositional data such as closure and the `constant sum problem' (for a notable exception, see Rollinson, 1993; Ague, 1994). Excuses aside, it is important that the uncertainties in the chemical data under discussion be understood and well documented for the reader, which we apparently did not do! Therefore, we have recalculated Table 1 from Yoshinobu and Girty (1999) using the more rigorous statistical procedures outlined in Owens' Discussion and in Warren and Girty (1999). Included in the accompanying revised Table 1 are the 95% con®dence intervals for density measurements (which were not included in our original paper) as well as corrected 95% con®dence bands for all key chemical parameters. In addition, we have recalculated TAl, and the mass redistribution of silica using both tSi Al and equations discussed in Warren and Girty (1999). The results * Corresponding author. E-mail address: aaron.yoshinobu@ttu.edu (A.S. Yoshinobu). show TAl to be 11:128:4%: In contrast, tSi Al is recalculated to be 16:028:9% while the slightly dierent procedure given in Warren and Girty (1999) for calculating mass change for a mobile species indicates a value of 16:0%12% ÿ10:5% for SiO2. Finally, the volume strain, e, is recalculated to be ÿ12:528:3%: All uncertainties for estimates of e, TAl, and tSi Al are given as 2s values, and were calculated utilizing standard error propagation models following methods outlined in Warren and Girty (1999), and discussed by Dr. Owens. As noted in our introductory comments, none of these recalculated values dier signi®cantly from the original values cited in our paper, and thus change none of our conclusions. Therefore, we conclude that silica mass may have been removed from the aureole of the Emigrant Gap pluton allowing volume strains to occur during the construction of the magma chamber. Given that many shallow-crustal pluton±host rock systems in a variety of fossilized arcs display features similar to those described in our paper, we wonder whether mass transfer and volume changes of varying magnitudes may be common phenomena during magma emplacement. References Ague, J.J., 1994. Mass transfer during Barrovian metamorphism of pelites, south-central Connecticut. I: Evidence for changes in composition and volume. American Journal of Science 294, 989± 1057. Rollinson, H., 1993. Using Geochemical Data: Evaluation, Presentation, Interpretation. John Wiley, New York 352 pp. Warren, H.N., Girty, G.H., 1999. A Matlab 5 program for calculating the statistics of mass change. Journal of Geoscience Education 47, 313±320. Yoshinobu, A.S., Girty, G.H., 1999. Measuring host rock volume changes during magma emplacement. Journal of Structural Geology 21, 111±116. 0191-8141/00/$ - see front matter # 2000 Elsevier Science Ltd. All rights reserved. PII: S 0 1 9 1 - 8 1 4 1 ( 9 9 ) 0 0 1 7 0 - 4 522 A.S. Yoshinobu, G.H. Girty / Journal of Structural Geology 22 (2000) 521±522 Table 1 Recalculated mean values of major oxide abundancesa Chlorite-grade belt Andalusite2cordierite belt K-feldspar2sillimanite belt Aureoleb Mean (n = 13) 95% uncertainty Mean (n = 17) 95% uncertainty Mean (n = 9) 95% uncertainty Mean (n = 26) 95% uncertainty SiO2 63.5 Al2O3 20.0 TiO2 0.92 6.42 FeOc MnO 0.07 CaO 0.58 MgO 2.18 K2O 4.68 Na2O 1.49 P2O5 0.12 Densityd 2.59 a 2.85 1.79 0.10 0.83 0.02 0.27 0.34 1.29 1.50 0.03 0.02 60.0 23.0 1.04 6.82 0.09 0.34 2.18 5.82 0.59 0.14 2.63 2.87 1.77 0.07 1.48 0.02 0.14 0.34 0.47 0.27 0.02 0.03 60.0 22.3 1.03 6.06 0.08 0.77 2.47 5.95 1.15 0.14 2.62 3.47 2.98 0.14 0.61 0.02 0.65 0.66 0.59 0.39 0.02 0.04 60.0 22.5 1.03 6.85 0.08 0.52 2.25 5.86 0.82 0.15 2.63 1.64 1.15 0.06 0.75 0.01 0.22 0.27 0.30 0.20 0.05 0.02 Mean compositions were normalized on a volatile- and LOI-free basis. Student's t test indicates no dierence between the andalusite2cordierite and potassium feldspar2sillimanite belts with the exception of Na2O; therefore data were combined to form the aureole mean. Student's t test indicates that there is some likelihood that silica mass was removed during development of the aureole. c Total iron as FeO. d Bulk density measured in g/cm3. All uncertainties are calculated on the basis of ta=2 sX , where ta=2 represents the Student's t value for 95% p con®dence, and sX is the standard error of the mean calculated as s= n, where s is the sample standard deviation and n is the number of specimens in the sample. b
