Stat 301 Lab 6: Due March 10 Spring 2014
advertisement

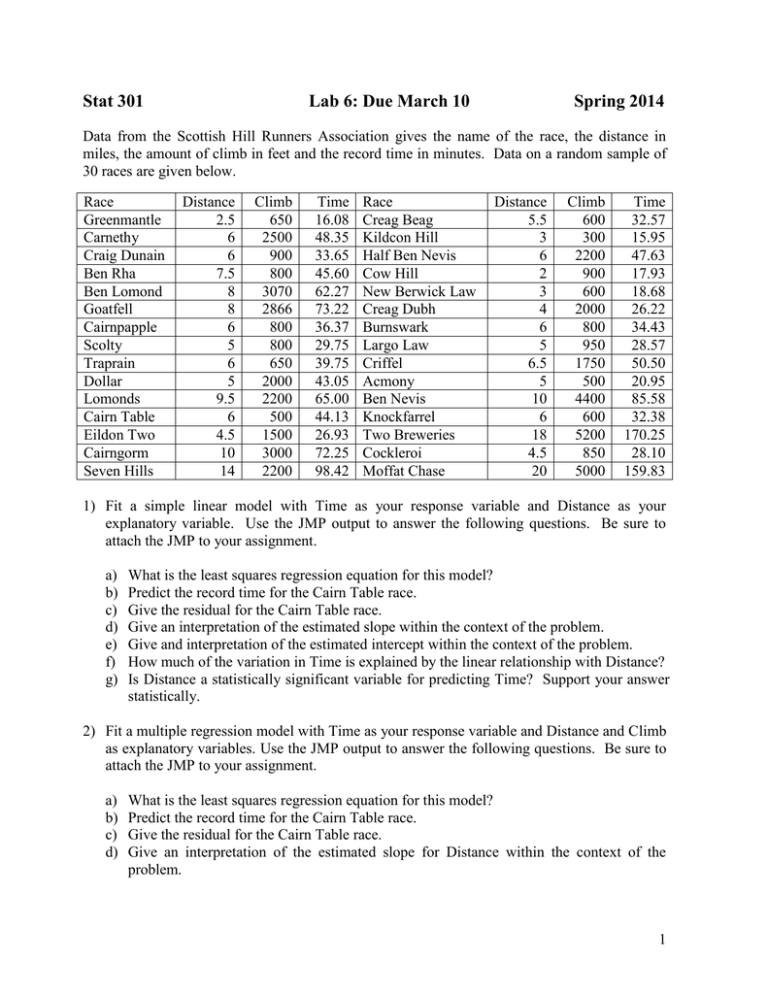
Stat 301 Lab 6: Due March 10 Spring 2014 Data from the Scottish Hill Runners Association gives the name of the race, the distance in miles, the amount of climb in feet and the record time in minutes. Data on a random sample of 30 races are given below. Race Greenmantle Carnethy Craig Dunain Ben Rha Ben Lomond Goatfell Cairnpapple Scolty Traprain Dollar Lomonds Cairn Table Eildon Two Cairngorm Seven Hills Distance 2.5 6 6 7.5 8 8 6 5 6 5 9.5 6 4.5 10 14 Climb 650 2500 900 800 3070 2866 800 800 650 2000 2200 500 1500 3000 2200 Time 16.08 48.35 33.65 45.60 62.27 73.22 36.37 29.75 39.75 43.05 65.00 44.13 26.93 72.25 98.42 Race Creag Beag Kildcon Hill Half Ben Nevis Cow Hill New Berwick Law Creag Dubh Burnswark Largo Law Criffel Acmony Ben Nevis Knockfarrel Two Breweries Cockleroi Moffat Chase Distance 5.5 3 6 2 3 4 6 5 6.5 5 10 6 18 4.5 20 Climb 600 300 2200 900 600 2000 800 950 1750 500 4400 600 5200 850 5000 Time 32.57 15.95 47.63 17.93 18.68 26.22 34.43 28.57 50.50 20.95 85.58 32.38 170.25 28.10 159.83 1) Fit a simple linear model with Time as your response variable and Distance as your explanatory variable. Use the JMP output to answer the following questions. Be sure to attach the JMP to your assignment. a) b) c) d) e) f) g) What is the least squares regression equation for this model? Predict the record time for the Cairn Table race. Give the residual for the Cairn Table race. Give an interpretation of the estimated slope within the context of the problem. Give and interpretation of the estimated intercept within the context of the problem. How much of the variation in Time is explained by the linear relationship with Distance? Is Distance a statistically significant variable for predicting Time? Support your answer statistically. 2) Fit a multiple regression model with Time as your response variable and Distance and Climb as explanatory variables. Use the JMP output to answer the following questions. Be sure to attach the JMP to your assignment. a) b) c) d) What is the least squares regression equation for this model? Predict the record time for the Cairn Table race. Give the residual for the Cairn Table race. Give an interpretation of the estimated slope for Distance within the context of the problem. 1 e) Give an interpretation of the estimated slope for Climb within the context of the problem. f) Does Climb add significantly to the model with Distance? Support your answer statistically. 3) Fit a multiple regression model with Time as your response variable and Distance, Climb, and Distance*Climb as explanatory variables. Be careful! Remember to turn off the Center Polynomial option before you fit the model. Use the JMP output to answer the following questions. Be sure to attach the JMP to your assignment. a) b) c) d) What is the least squares regression equation for this model? Predict the record time for the Cairn Table race. Give the residual for the Cairn Table race. Does Distance*Climb add significantly to the model with Distance and Climb? Support your answer statistically. e) What does the result in d) tell you about interaction between Distance and Climb? f) What does the result in d) tell you about the relationship between Time and Distance as you change the amount of climb? 4) Fit a multiple regression model with Time as your response variable and Distance, Climb, and (Distance – Mean Distance)*(Climb – Mean Climb) i.e. leave the Center Polynomial option turned on. Use the JMP output to answer the following questions. Be sure to attach the JMP to your assignment. a) b) c) d) What is the least squares regression equation for this model? Predict the record time for the Cairn Table race. Give the residual for the Cairn Table race. Does (Distance – Mean Distance)*(Climb – Mean Climb) add significantly to the model with Distance and climb? e) Compare your results in 3) d) to your results in 4) d)? 5) Save the residuals for the interaction model in 4). Plot the residuals versus Distance. Plot the residuals versus Climb. Analyze the distribution of the residuals. Use the JMP output to answer the following questions. Be sure to attach the JMP to your assignment. a) What do the plots of residuals versus the explanatory variables tell you about the adequacy of the interaction model? What do they tell you about the equal standard deviation condition? Be sure to support your answers by referring to the plots. b) What does the analysis of the distribution of residuals tell you about the conditions of identically and normally distributed residuals? Be sure to support your answers by referring to the analysis. 2


