Stat 401B Lab 6: Due October 18 Fall 2005
advertisement
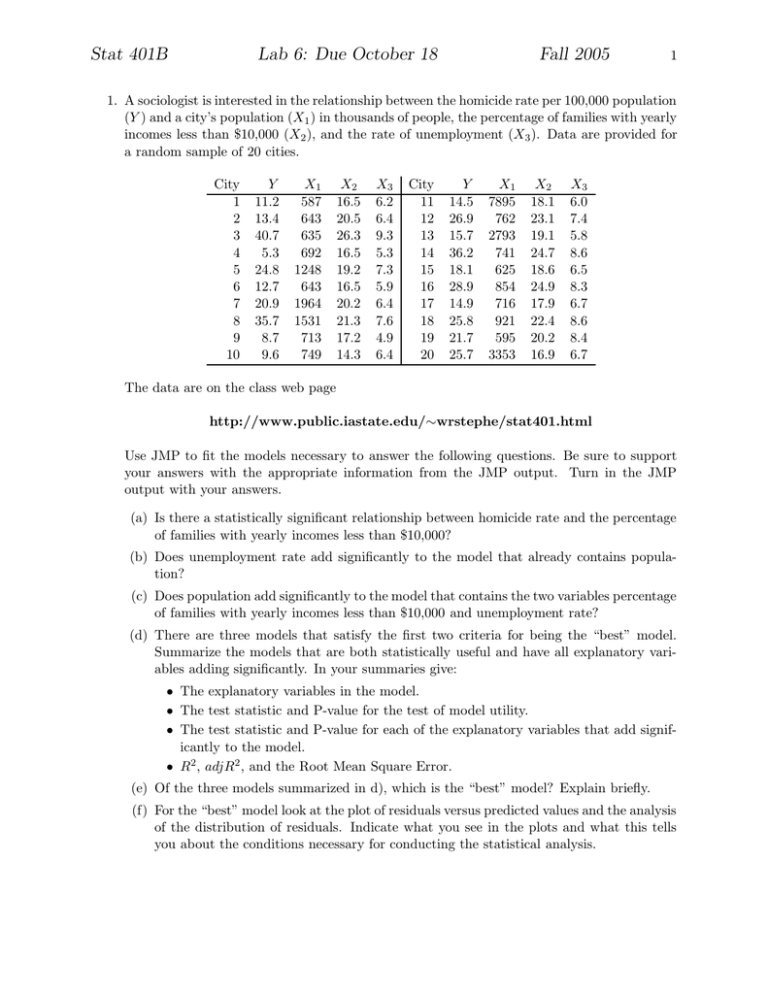
Stat 401B Lab 6: Due October 18 Fall 2005 1 1. A sociologist is interested in the relationship between the homicide rate per 100,000 population (Y ) and a city’s population (X1 ) in thousands of people, the percentage of families with yearly incomes less than $10,000 (X2 ), and the rate of unemployment (X3 ). Data are provided for a random sample of 20 cities. City 1 2 3 4 5 6 7 8 9 10 Y 11.2 13.4 40.7 5.3 24.8 12.7 20.9 35.7 8.7 9.6 X1 587 643 635 692 1248 643 1964 1531 713 749 X2 16.5 20.5 26.3 16.5 19.2 16.5 20.2 21.3 17.2 14.3 X3 6.2 6.4 9.3 5.3 7.3 5.9 6.4 7.6 4.9 6.4 City 11 12 13 14 15 16 17 18 19 20 Y 14.5 26.9 15.7 36.2 18.1 28.9 14.9 25.8 21.7 25.7 X1 7895 762 2793 741 625 854 716 921 595 3353 X2 18.1 23.1 19.1 24.7 18.6 24.9 17.9 22.4 20.2 16.9 X3 6.0 7.4 5.8 8.6 6.5 8.3 6.7 8.6 8.4 6.7 The data are on the class web page http://www.public.iastate.edu/∼wrstephe/stat401.html Use JMP to fit the models necessary to answer the following questions. Be sure to support your answers with the appropriate information from the JMP output. Turn in the JMP output with your answers. (a) Is there a statistically significant relationship between homicide rate and the percentage of families with yearly incomes less than $10,000? (b) Does unemployment rate add significantly to the model that already contains population? (c) Does population add significantly to the model that contains the two variables percentage of families with yearly incomes less than $10,000 and unemployment rate? (d) There are three models that satisfy the first two criteria for being the “best” model. Summarize the models that are both statistically useful and have all explanatory variables adding significantly. In your summaries give: • The explanatory variables in the model. • The test statistic and P-value for the test of model utility. • The test statistic and P-value for each of the explanatory variables that add significantly to the model. • R2 , adjR2 , and the Root Mean Square Error. (e) Of the three models summarized in d), which is the “best” model? Explain briefly. (f) For the “best” model look at the plot of residuals versus predicted values and the analysis of the distribution of residuals. Indicate what you see in the plots and what this tells you about the conditions necessary for conducting the statistical analysis.
