Evaluating the effects of private-public partnerships in public health Importance of partnerships:
advertisement

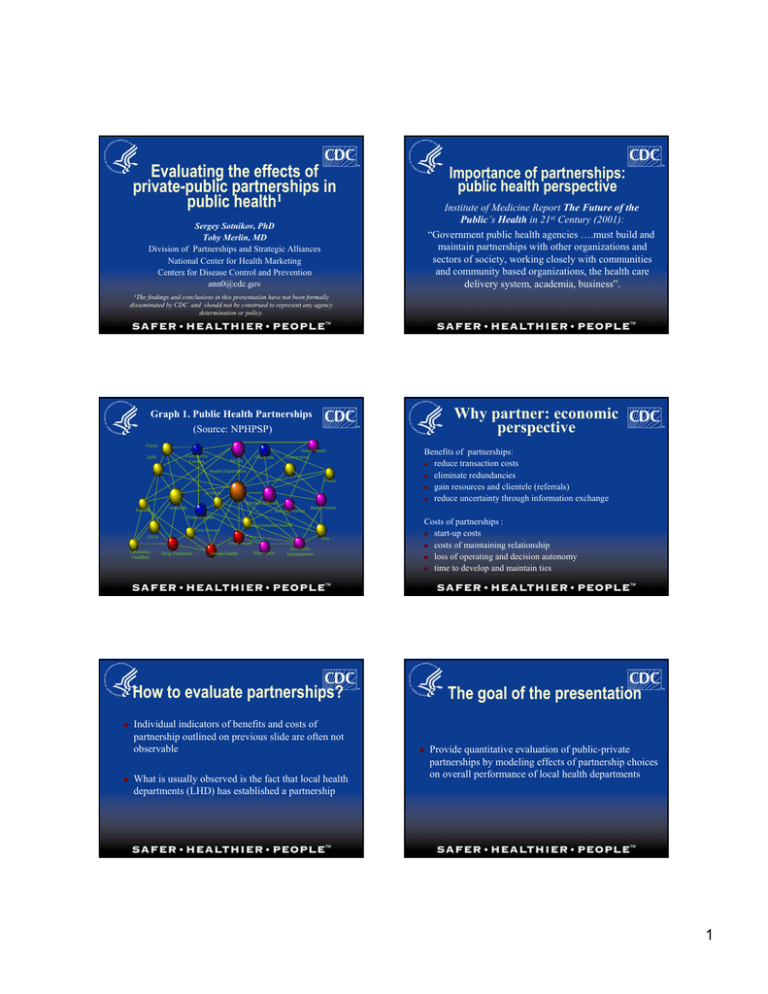
Evaluating the effects of private-public partnerships in public health1 Importance of partnerships: public health perspective Institute of Medicine Report The Future of the Public’s Health in 21st Century (2001): “Government public health agencies ….must build and maintain partnerships with other organizations and sectors of society, working closely with communities and community based organizations, the health care delivery system, academia, business”. Sergey Sotnikov, PhD Toby Merlin, MD Division of Partnerships and Strategic Alliances National Center for Health Marketing Centers for Disease Control and Prevention ann0@cdc.gov 1The findings and conclusions in this presentation have not been formally disseminated by CDC and should not be construed to represent any agency determination or policy. Why partner: economic perspective Graph 1. Public Health Partnerships (Source: NPHPSP) Police EMS Community Centers Home Health Corrections Churches MCOs Health Department Parks Schools Elected Officials Doctors Hospitals Nursing Homes Mass Transit Philanthropist Environmental Health Civic Groups CHCs Fire Tribal Health Laboratory Facilities Drug Treatment Mental Health Employers Benefits of partnerships: reduce transaction costs eliminate redundancies gain resources and clientele (referrals) reduce uncertainty through information exchange Economic Development Costs of partnerships : start-up costs costs of maintaining relationship loss of operating and decision autonomy time to develop and maintain ties How to evaluate partnerships? Individual indicators of benefits and costs of partnership outlined on previous slide are often not observable What is usually observed is the fact that local health departments (LHD) has established a partnership The goal of the presentation Provide quantitative evaluation of public-private partnerships by modeling effects of partnership choices on overall performance of local health departments 1 Data sources Research Questions Outcome variable Performance data for 2000 obtained from National Public Health Performance Standards Program (NPHPSP) and covered 147 health departments in three states. Input, infrastructure and partnership variables The 1996 NACCHO survey of public health infrastructure CDC Health Alert Network program USDA rural continuum codes What is the role of public-private partnerships in explaining variations in performance of health departments? How large are the effects of partnerships on performance? Are these partnership effects endogenous? Are there any differences in partnership effects at different level of LHD performance? NPHPSP instrument Table 1. Descriptive Std. statistics Based on a concept of 10 essential pubic health services. Instrument contains description of 30 performance standards across these 10 essential services. After thorough description of a standard managers of LHD are asked the question : “To what extent does the local public health agency achieve the model standard?”. Performance score is calculated as a mean of these responses across 30 standards Mean Dev. Min LHD Performance score Variable name 63 15 34 93 LHD expenditures per capita served 51 45 5 329 LHD FTE per 100,000 people served 82 65 12 485 High speed internet connectivity (Yes=1, No=0) 0.56 0.40 0 1 LHD Director has MD or MPH degree (Yes=1, No=0) 0.30 0.46 0 1 5 3 1 9 18 6 3 32 Urbanization - 1 (heavily urbanized) to 9 (isolated rural) Number of partners LHD has partnership with: Max Mean Local, State, Federal Government Hospitals Independent Care Providers 0.77 0.76 0.72 Non-Profits Universities/Academic Centers Community and Civic Groups 0.71 0.63 0.63 Professional Associations Community Health Centers Local Board of Health 0.61 0.59 0.56 Faith Communities Businesses 0.44 0.43 Insurance Companies 0.29 Methods Model 1 OLS regression of partner effects LHD performance score = f (Expenditures, FTE, High speed internet, LHD Director education, Number of partners, Partnership, by type) + error Model 2 Probit model of business partner choice LHD has business partner = g (Expenditures, FTE, High speed internet, LHD Director education, Number of partners, Partnership, by type, except with business, Urbanization level) + error 2 Table 2 Model 1 results Methods – continued Model 3 Accounting for endogeneity Re-estimate Model 1 by OLS using predicted probability of having business partner from Model 2 instead of dichotomous business partner variable Model 4 Accounting for heterogeneity of partnership effects on LHD performance Re-estimate Model 1 by quantile regression (QR) technique using predicted probability of having business partner from Model 2 Dependent variable: LHD Mean Performance Score Coeff. Constant Local Board of Health Local, State, Federal Government Universities/Academic Centers 0.000 LHD expenditures per capita 0.095 3.38 0.001 LHD FTE per 100,000 people -0.051 -2.68 0.008 High speed internet connectivity (Yes=1, No=0) 7.263 2.11 0.037 LHD Director has MD or MPH degree (Yes=1, No=0) -0.607 -0.25 0.800 Number of partners -0.002 -0.01 0.994 Model1 - Results t P>t 3.108 0.98 0.329 -10.174 -2.61 0.010 11.032 3.58 0.000 Community Health Centers 0.134 0.05 0.960 Hospitals 2.843 0.69 0.492 Independent Care Providers 3.914 1.03 0.304 Insurance Companies -3.848 -1.43 0.157 -15.880 -4.19 0.000 2.176 0.55 0.586 Community and Civic Groups -1.981 -0.51 0.608 Businesses 10.458 3.36 0.001 Faith Communities -0.120 -0.04 0.970 Non-Profits Professional Associations Model 1 Issues Statistical association between partnerships and performance does not necessarily imply causation Some LHD may be more likely to be engaged in partnerships due to unobserved characteristics – endogeneity issue Outcome variable may have skewed distribution Higher mean performance scores are statistically associated with LHD partnerships with: Academic institutions (+11.0%) Businesses (+10.4%) Worse than average performance if LHD has partnerships with: Non-profit organizations (-15.9%) Government agencies (-10.2%) No statistically significant effects for other types of partnerships Model 2 Probit Model– Determinant of LHD partnerships with businesses Coef. z P>z 2.87 4.39 0.00 LHD expenditures per capita -0.01 -2.12 0.03 LHD FTE per 100,000 people 0.00 1.16 0.25 High speed internet connectivity (Yes=1, No=0) 0.31 0.93 0.35 Constant LHD Director has MD or MPH degree (Yes=1, No=0) 0.50 1.89 0.06 -0.14 -5.01 0.00 Total population served 0.00 -2.14 0.03 Total population served squared 0.00 2.03 0.04 -0.12 -1.94 0.05 Number of partners P>t 8.29 Table 2 - continued Coeff. t 60.154 Will use partnerships with businesses as an example to address these issues Urbaization (urbanized=1...rural=9) 3 Model 2 - Results Models 3 and 4 - Results Public–private partnerships are more likely to develop if: LHD per capita spending are low compared to peers LHD is located in more urbanized county LHD director has training in public health LHD is engaged in fewer partnerships Public-private partnerships effects on performance are 11 percentage points higher after correction for endogeneity Partnerships with businesses have no effect on performance at low and high end of the distribution (Graph 2). P e r c e n ta g e p o in t g a in s G ra p h 2 E f fe c t s o f p riv a t e -p u b lic p a rt n e rs h ip s o n L H D p e rf o rm a n c e : th re e m o d e ls c o m p a re d Conclusions 25 20 15 10 5 0 Public-private partnerships are important determinants of LHD performance Relationship between the effects of partnerships on performance is neither exogenous, nor linear “Returns” to LHD partnerships with businesses are concave function of LHD performance Quantile regression is a useful public health policy tool addressing heterogeneity of returns to partnerships across the wide range of distribution of performance outcomes 0 .1 0 .2 0 .3 0 .4 0 .5 0 .6 0 .7 0 .8 Q u a n t ile s o f p e rfo rm a n c e Q R - c o rre c te d fo r e n d o g e n e ity OLS O L S - c o rre c te d fo r e n d o g e n e ity 0 .9 4


