Estimated Reductions in Influenza - related Mortality among the Elderly through
advertisement
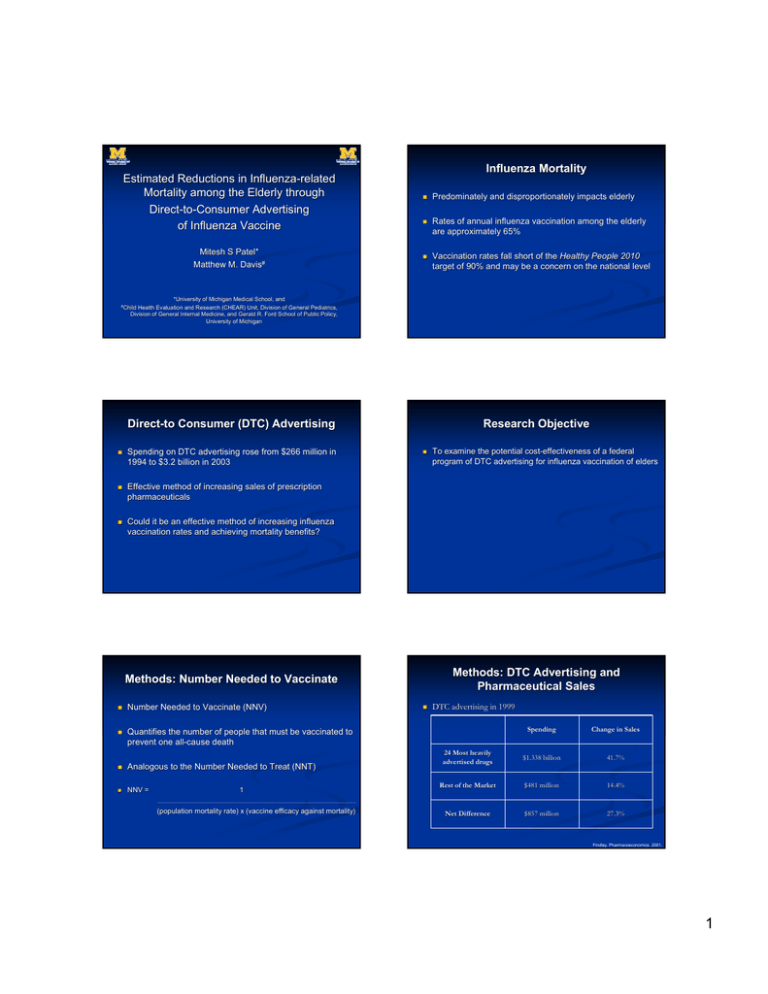
Estimated Reductions in InfluenzaInfluenza-related Mortality among the Elderly through DirectDirect-toto-Consumer Advertising of Influenza Vaccine Mitesh S Patel* Matthew M. Davis# Influenza Mortality Predominately and disproportionately impacts elderly Rates of annual influenza vaccination among the elderly are approximately 65% Vaccination rates fall short of the Healthy People 2010 target of 90% and may be a concern on the national level *University of Michigan Medical School, and Health Evaluation and Research (CHEAR) Unit, Division of General General Pediatrics, Division of General Internal Medicine, and Gerald R. Ford School of Public Policy, University of Michigan #Child DirectDirect-to Consumer (DTC) Advertising Spending on DTC advertising rose from $266 million in 1994 to $3.2 billion in 2003 Effective method of increasing sales of prescription pharmaceuticals Could it be an effective method of increasing influenza vaccination rates and achieving mortality benefits? Research Objective Methods: DTC Advertising and Pharmaceutical Sales Methods: Number Needed to Vaccinate Number Needed to Vaccinate (NNV) Quantifies the number of people that must be vaccinated to prevent one allall-cause death Analogous to the Number Needed to Treat (NNT) NNV = 1 To examine the potential costcost-effectiveness of a federal program of DTC advertising for influenza vaccination of elders DTC advertising in 1999 Spending Change in Sales 24 Most heavily advertised drugs $1.338 billion 41.7% Rest of the Market $481 million 14.4% Net Difference $857 million 27.3% ___________________________________________________________________________________________________________________________ ___________________________________________________________________________________________________________________________ (population mortality rate) x (vaccine efficacy efficacy against mortality) Findlay. Pharmacoeconomics. 2001. 1 Methods: Vaccination Rate Increase Influenza Elderly Vaccination Rate 90 85 80 75 . 70 65 95 90 Influenza Elderly Vaccination Rate . 95 Methods: Vaccination Rate Increase 85 ? 80 75 70 65 60 60 2005 2006 2007 2008 2009 2010 2011 2012 2013 2014 2015 2005 2006 2007 2008 Year 2009 2010 2011 2012 2013 2014 2015 Year Methods: Vaccination Rate Increase Methods: Model Parameters Influenza Elderly Vaccination Rate 95 Base Case Estimate Range for Sensitivity Analysis 194.1 million +/- 10% 90 Variable 85 Costs DTC Advertising, $ 80 Increase per year, % 75 Vaccine Dose, $ Increase per year, % 70 Vaccine Admin Fee, $ 65 Increase per year, % Population Mortality Rate 60 2005 2006 2007 2008 2009 2010 2011 2012 2013 2014 3 12.20 10 5 - 15 18.90 3 1.5 – 6 132.5/100,000 2015 Year Methods: Model Parameters Variable Base Case Estimate Range for Sensitivity Analysis 194.1 million +/- 10% Costs DTC Advertising, $ Increase per year, % Vaccine Dose, $ Increase per year, % Vaccine Admin Fee, $ Increase per year, % Population Mortality Rate Methods: Model Parameters Variable Base Case Estimate Range for Sensitivity Analysis 194.1 million +/- 10% Costs Vaccine Dose, $ 12.20 10 5 - 15 132.5/100,000 Increase per year, % Vaccine Admin Fee, $ 18.90 3 DTC Advertising, $ Increase per year, % 3 1.5 – 6 Increase per year, % Population Mortality Rate 3 12.20 10 5 - 15 18.90 3 1.5 – 6 132.5/100,000 2 Methods: Model Parameters Methods: Model Parameters Variable Base Case Estimate Range for Sensitivity Analysis 194.1 million +/- 10% Costs DTC Advertising, $ Increase per year, % 3 Vaccine Dose, $ 12.20 Increase per year, % 10 Vaccine Admin Fee, $ 5 - 15 18.90 Increase per year, % 3 Population Mortality Rate 1.5 – 6 132.5/100,000 Variable Base Case Estimate Range for Sensitivity Analysis Vaccine Efficacy, % Year 2006 67.61 56 – 76 (95% CI) Elderly Population, millions (Revaccinated Persons, %) Year 2006 Year 2007 Year 2008 Year 2009 Year 2010 Year 2011 Year 2012 Year 2013 Year 2014 Year 2015 37.2 (60.0) 37.8 (69.9) 38.7 (74.2) 39.8 (77.5) 40.2 (81.9) 41.1 (83.1) 42.6 (83.5) 44.0 (85.0) 45.3 (86.2) 46.8 (86.6) Methods: Model Parameters Methods: Model Parameters Variable Base Case Estimate Range for Sensitivity Analysis Variable Base Case Estimate Range for Sensitivity Analysis Vaccine Efficacy, % Year 2006 67.61 56 – 76 (95% CI) Vaccine Efficacy, % Year 2006 67.61 56 – 76 (95% CI) Elderly Population, millions (Revaccinated Persons, %) Year 2006 Year 2007 Year 2008 Year 2009 Year 2010 Year 2011 Year 2012 Year 2013 Year 2014 Year 2015 37.2 (60.0) 37.8 (69.9) 38.7 (74.2) 39.8 (77.5) 40.2 (81.9) 41.1 (83.1) 42.6 (83.5) 44.0 (85.0) 45.3 (86.2) 46.8 (86.6) Elderly Population, millions (Revaccinated Persons, %) Year 2006 Year 2007 Year 2008 Year 2009 Year 2010 Year 2011 Year 2012 Year 2013 Year 2014 Year 2015 37.2 (60.0) 37.8 (69.9) 38.7 (74.2) 39.8 (77.5) 40.2 (81.9) 41.1 (83.1) 42.6 (83.5) 44.0 (85.0) 45.3 (86.2) 46.8 (86.6) Results: Base Case – First Year of Program Methods: Primary Outcome Measures For each year 20062006-2015 we estimated # Reduction in mortality 95% CI NNV Cost per lifelife-year saved = Elderly lives saved ∑Year = x [cost (DTC + Vaccination)] - (x-1) ∑Year = (x- Year=2006 [cost (DTC + Vaccination)] Year=2006 __________________________________________________ (x-1) [life∑Year = x [life[life-years saved] - ∑Year = (x[life-years saved] Year=2006 Life-years saved Year=2006 3 Results: Elderly Lives Saved Results: Base Case – First Year of Program 11000 # 95% CI NNV 1,116 993 – 1,348 Elderly lives saved 1,999 1,656 – 2,247 Life-years saved 22,768 18,861 - 25,598 Estimated Number of Elderly Lives Saved 10000 9000 8000 7000 6000 5000 4000 3000 2000 1000 0 2006 2007 2008 2009 2010 2011 2012 2013 2014 2015 Year Lower Bound Vaccine Efficacy Cost of DTC Advertising Program (millions US$) Cost of Incremental Increase in Vaccination (millions US$) Incremental Life-Years Saved Cost Per Life-Year Saved (US$) (95% CI) Mean Vaccine Efficacy Results: CostCost-Effectiveness of a 1010-year DTC Program for Influenza Vaccine Results: CostCost-Effectiveness of a 1010-year DTC Program for Influenza Vaccine Overall Vaccine Efficacy (%) (95% CI) Upper Bound Vaccine Efficacy Year Overall Vaccination Rate (%) Overall Vaccine Efficacy (%) (95% CI) Cost of DTC Advertising Program (millions US$) Cost of Incremental Increase in Vaccination (millions US$) Incremental Life-Years Saved Cost Per Life-Year Saved (US$) (95% CI) Year Overall Vaccination Rate (%) 2006 71 67.61 (56 – 76) 194.1 69.4 22,768 11,573 (10,293 - 13,970) 2011 86.5 70.12 (58.51 – 78.51) 225.0 25.6 5,676 44,159 (39,440 – 52,921) 2012 87.75 70.16 (58.55 – 78.55) 231.7 23.5 4,790 53,291 (47,599 – 63,858) 88.75 70.32 (58.71 – 78.71) 238.7 20.7 3,874 66,945 (59,809 – 80,183) 89.5 70.45 (58.84 – 78.84) 245.9 17.0 2,925 89,884 (80,319 – 107,619) 90 70.50 (58.89 – 78.89) 253.2 12.5 1,961 135,535 (121,121 – 162,255) 2007 76 68.68 (57.07 – 77.07) 199.9 62.2 19,057 13,756 (12,259 – 16,555) 2008 79.75 69.15 (57.57 – 77.54) 205.9 50.5 14,324 17,900 (15,963 - 21,512) 2009 82.75 69.51 (57.90 – 77.90) 212.1 44.0 11,505 22,258 (19,860 – 26,721) 2010 85 69.99 (58.38 – 78.38) 218.4 35.4 8,552 29,685 (26,508 – 35,589) Results: CostCost-Effectiveness of a 1010-year DTC Program for Influenza Vaccine 2015 Results: Overall CostCost-Effectiveness $40,000 Cost of DTC Advertising Program (millions US$) Cost of Incremental Increase in Vaccination (millions US$) Incremental Life-Years Saved Cost Per Life-Year Saved (US$) (95% CI) Year Overall Vaccination Rate (%) 2011 86.5 70.12 (58.51 – 78.51) 225.0 25.6 5,676 44,159 (39,440 – 52,921) 2012 87.75 70.16 (58.55 – 78.55) 231.7 23.5 4,790 53,291 (47,599 – 63,858) 2013 88.75 70.32 (58.71 – 78.71) 238.7 20.7 3,874 66,945 (59,809 – 80,183) 2014 89.5 70.45 (58.84 – 78.84) 245.9 17.0 2,925 89,884 (80,319 – 107,619) 2015 90 70.50 (58.89 – 78.89) 253.2 12.5 1,961 135,535 (121,121 – 162,255) 2,225 360.9 95,434 27,096 (24,159 – 32,575) TOTAL 2014 Overall Cost per Life Year Saved Overall Vaccine Efficacy (%) (95% CI) 2013 $35,000 $30,000 $25,000 $20,000 $15,000 $10,000 $5,000 $0 Best Case Base Case Worst Case 4 Study Limitations Mortality benefits of influenza vaccination DTC advertising has only been studied for boosting pharmaceutical sales Medicare incurs greater program costs Annual cost per average beneficiary is $5,400 Average life expectancy of elders in hypothetical cohort is 11.7 years Implications First study to suggest potential benefits of DTC advertising on public immunization efforts DTC advertising directed towards elders may Induce demand for influenza vaccine Raise vaccination rates towards the target of 90% Achieve mortality benefits Be costcost-effective for the Federal Government to pursue Summary Overall the cost per lifelife-year saved is about $27,000 for the 1010-year DTC promotion of influenza vaccine for the elderly Sensitivity analysis Worst case Cost per lifelife-year saved < $40,000 Total lives saved > 7,000 lives Total cost of DTC advertising over 10 years = $2.2 billion Estimated Reductions in InfluenzaInfluenza-related Mortality among the Elderly through DirectDirect-toto-Consumer Advertising of Influenza Vaccine Mitesh S Patel* Matthew M. Davis# *University of Michigan Medical School, and Health Evaluation and Research (CHEAR) Unit, Division of General General Pediatrics, Division of General Internal Medicine, and Gerald R. Ford School of Public Policy, University of Michigan #Child 5
