• Research Objective
advertisement
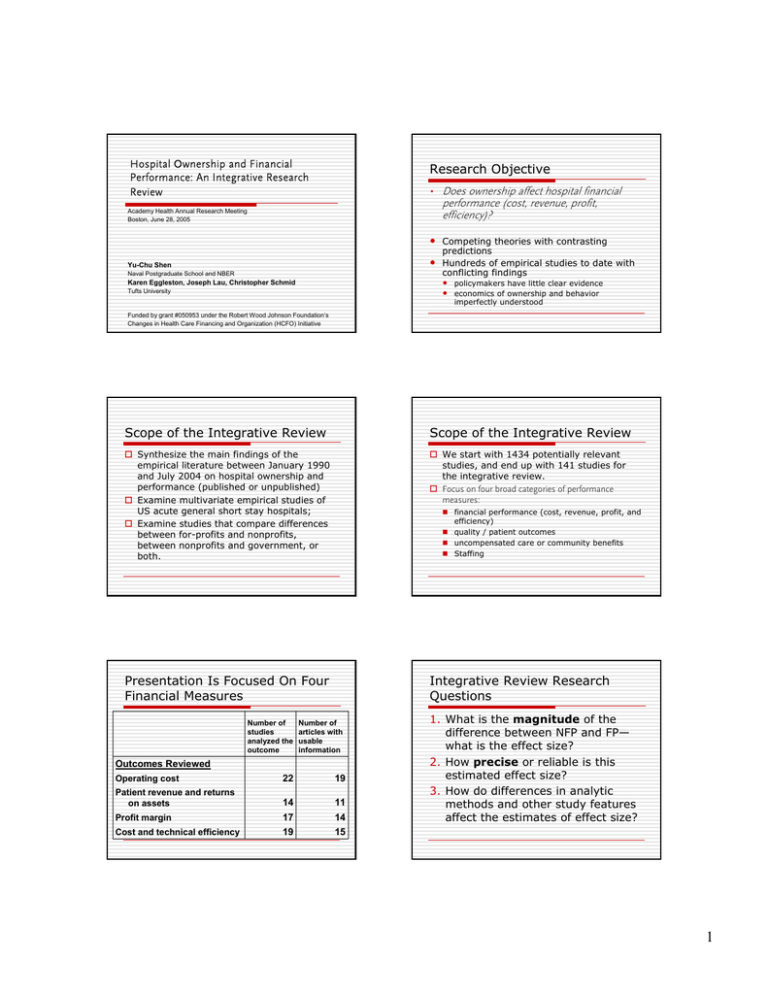
Hospital Ownership and Financial Performance: An Integrative Research Review Research Objective • Does ownership affect hospital financial performance (cost, revenue, profit, efficiency)? Academy Health Annual Research Meeting Boston, June 28, 2005 • • Yu-Chu Shen Naval Postgraduate School and NBER Competing theories with contrasting predictions Hundreds of empirical studies to date with conflicting findings • • Karen Eggleston, Joseph Lau, Christopher Schmid Tufts University policymakers have little clear evidence economics of ownership and behavior imperfectly understood Funded by grant #050953 under the Robert Wood Johnson Foundation’s Changes in Health Care Financing and Organization (HCFO) Initiative Scope of the Integrative Review Scope of the Integrative Review Synthesize the main findings of the empirical literature between January 1990 and July 2004 on hospital ownership and performance (published or unpublished) Examine multivariate empirical studies of US acute general short stay hospitals; Examine studies that compare differences between for-profits and nonprofits, between nonprofits and government, or both. We start with 1434 potentially relevant studies, and end up with 141 studies for the integrative review. Focus on four broad categories of performance measures: Presentation Is Focused On Four Financial Measures Integrative Review Research Questions Number of studies analyzed the outcome financial performance (cost, revenue, profit, and efficiency) quality / patient outcomes uncompensated care or community benefits Staffing Number of articles with usable information Outcomes Reviewed Operating cost Patient revenue and returns on assets 22 19 14 11 Profit margin 17 14 Cost and technical efficiency 19 15 1. What is the magnitude of the difference between NFP and FP— what is the effect size? 2. How precise or reliable is this estimated effect size? 3. How do differences in analytic methods and other study features affect the estimates of effect size? 1 Cost: Summary of N-F Effect Size By Method Types Categorizing Analytical Methods Three types of methodology rigor Type 3: if a study meets both of the following conditions: (a) uses panel estimation or explicitly accounts for potential selection problem (b) includes two of the following three sets of controls: patient level, hospital level, market level Type 2: if meets EITHER (a) or (b) Type 1: if meets NEITHER (a) nor (b) Effect size (95% CI) Study method_level==0 gautam1996 wang2001 shukla1997 Method Type 1 % Weight 0.11 ( 0.04, 0.18) 0.23 ( 0.01, 0.45) 0.27 ( 0.05, 0.49) Subtotal 5.3 1.6 1.6 0.16 ( 0.06, 0.25) 8.5 -0.23 (-0.38,-0.08) -0.08 (-0.12,-0.04) -0.03 (-0.08, 0.02) -0.01 (-0.03, 0.02) 2.7 6.3 6.0 6.8 method_level==1 campbell 1990 goes1995 fournier1997 connor1998 Method Type 2 becker2002 clement1997 lawrence1990 Subtotal method_level==2 shen2003b wilcox-gok2002 carey2000 carey1997 Method Type 3 mark1999 zeckhauser1995 bazzoli2000 potter2001 Subtotal Overall FP is less costly -.48845 0 0.04 ( 0.01, 0.06) 0.04 ( 0.00, 0.08) 0.12 ( 0.03, 0.20) 6.7 6.3 4.6 -0.01 (-0.05, 0.04) 39.4 -0.06 (-0.08,-0.04) 6.8 -0.05 (-0.10, 0.00) -0.04 (-0.05,-0.02) 0.00 (-0.02, 0.03) 6.1 6.9 6.8 0.02 ( 0.01, 0.03) 0.05 (-0.00, 0.11) 0.08 ( 0.02, 0.14) 0.11 ( 0.10, 0.13) 7.0 5.8 5.7 6.9 0.01 (-0.03, 0.06) 52.0 0.02 (-0.01, 0.05) 100.0 FP is more costly .488456 Effect size Cost: Summary of N-F Effect Size By Covered Region Study Effec t size (95% CI) national==0 campbell1990 goes1995 wilc ox-gok2002 fournier1997 zeckhauser1995 wang2001 shukla1997 Subtotal -0.23 (-0.38,-0.08) -0.08 (-0.12,-0.04) -0.05 (-0.10, 0.00) -0.03 (-0.08, 0.02) 0.05 ( -0.00, 0.11) 0.23 ( 0.01, 0.45) 0.27 ( 0.05, 0.49) -0.01 (-0.08, 0.05) 2.7 6.3 6.1 6.0 5.8 1.6 1.6 30.2 -0.06 (-0.08,-0.04) -0.04 (-0.05,-0.02) -0.01 (-0.03, 0.02) 0.00 ( -0.02, 0.03) 0.02 ( 0.01, 0.03) 0.04 ( 0.01, 0.06) 0.04 ( 0.00, 0.08) 0.08 ( 0.02, 0.14) 0.11 ( 0.10, 0.13) 0.11 ( 0.04, 0.18) 0.12 ( 0.03, 0.20) 0.03 ( -0.00, 0.07) 6.8 6.9 6.8 6.8 7.0 6.7 6.3 5.7 6.9 5.3 4.6 69.8 0.02 ( -0.01, 0.05) 100.0 national==1 shen2003b carey2000 connor1998 carey1997 mark1999 becker 2002 clement1997 bazzoli2000 potter2001 gautam1996 lawrence1990 Subtotal Single state sample National sample O verall FP is less costly - .48845 0 Effect size % Weight 0. 04 ( 0. 02, 0.06) 13.1 0. 07 ( 0. 04, 0.11) 0. 08 (-0.07, 0.23) 12.0 4.2 younis 2001 S ubtotal 0. 12 ( 0. 10, 0.14) 0. 08 ( 0. 03, 0.13) 13.1 42.4 met hod_level==2 shen2003b bazzoli2000 -0.02 (-0.04, 0.00) 0. 00 (-0.06, 0.06) 13.2 10.3 mark1999 wilcox-gok2002 S ubtotal 0. 02 ( 0. 01, 0.03) 0. 04 (-0.01, 0.09) 0. 01 (-0.02, 0.03) 13.6 11.2 48.3 0. 06 ( 0. 03, 0.10) 100.0 Method Type 2 Method Type 3 FP-. generates less 57406 revenue (-0.01, 0.09) (-0.07, 0.23) ( 0.06, 0.36) ( 0.06, 0.50) ( 0.14, 0.57) ( 0.05, 0.29) 11.2 4.2 4.5 2.4 2.4 24.8 natio nal==1 shen 2003b bazzoli2000 mark1999 conn or1998 clement1997 -0.0 2 (-0.04, 0.00) 0.00 (-0.06, 0.06) 0.02 ( 0.01, 0.03) 0.04 ( 0.02, 0.06) 0.07 ( 0.04, 0.11) 13.2 10.3 13.6 13.1 12.0 0.12 ( 0.10, 0.14) 0.04 (-0.00, 0.08) 13.1 75.2 0.06 ( 0.03, 0.10) 100.0 FP generates more .574 063 revenue 0 Eff ect size % Weight FP generates more .574063 revenue Profit Margin: Summary of N-F Effect Size By Method Type Effect size (95% CI) Study 0.04 0.08 0.21 0.28 0.35 0.17 0 Effect size 4.5 2.4 2.4 9.3 Method Type 1 ( ( ( ( % Weight 0. 06, 0.36) 0. 06, 0.50) 0. 14, 0.57) 0. 16, 0.37) Ov erall Effect size (95% CI) FP-.57406 generates less revenue 0. 21 0. 28 0. 35 0. 26 FP is more costly .488456 natio nal==0 wilcox-g ok2002 gapenski199 3 Single state molin ari1993 sample shukla1997 wang20 01 Subtotal Overa ll Effect s ize (95% CI) met hod_level==0 molinari1993 shukla1997 wang2001 S ubtotal clement 1997 gapenski1993 Stud y younis2001 Subtotal S tudy met hod_level==1 connor1998 Revenue: Summary of N-F Effect Size By Covered Region National sample Revenue: Summary of N-F Effect Size By Method Type method_level= =0 molinari1993 shukla1997 wang2001 Subtotal 0.20 0.22 0.28 0.23 Method Type 1 method_level= =1 gapenski1993 goes1995 picone2002 clement1997 connor1998 thor pe2001 Subtotal method_level= =2 bazzoli2000 mar k1999 wilcox-gok2002 shen2003b zeckhauser 1995 Subtotal Method Type 2 Method Type 3 Overall FP earns lower profit - .49741 0 Effect size % Weight ( 0.06, 0.35) ( 0.00, 0.44) ( 0.06, 0.50) ( 0.12, 0.33) 3.5 1.9 1.9 7.4 -0.09 ( -0.24, 0.06) 3.3 -0.03 0.02 0.04 0.06 0.28 0.06 ( -0.07, 0.00) ( 0.02, 0.03) ( 0.00, 0.08) ( 0.03, 0.08) ( 0.25, 0.32) (-0.02, 0.13) 8.8 9.9 8.8 9.5 9.0 49.2 0.01 0.02 0.02 0.02 0.05 0.02 (-0.05, 0.07) ( 0.00, 0.03) (-0.02, 0.07) ( 0.00, 0.04) (-0.01, 0.10) ( 0.01, 0.03) 7.7 9.9 8.3 9.6 8.0 43.4 0.06 ( 0.02, 0.09) 100.0 FP earns higher profit .497418 2 Profit Margin: Summary of N-F Effect Size By Covered Region Efficiency: Summary of N-F Effect Size By Covered Region Study Effect s ize (95% CI) Study Effect s ize (95% CI) national==0 gapenski1993 -0.09 (-0.24, 0.06) 3.3 national==0 li2001 0. 09 (-0.00, 0.18) -0.03 (-0.07, 0.00) 0. 02 (-0.02, 0.07) 0. 05 (-0.01, 0.10) 0. 20 ( 0.06, 0.35) 0. 22 ( 0.00, 0.44) 0. 28 ( 0.06, 0.50) 8.8 8.3 8.0 3.5 1.9 1.9 chirikos2000 chirikos1994 ferrier1996 sari2003 Subtotal Subtotal 0. 05 (-0.01, 0.12) 35.7 national==1 bazzoli2000 mark1999 shen2003b picone2002 clement 1997 0. 01 0. 02 0. 02 0. 02 0. 04 goes1995 wilcox-gok2002 zeckhauser1995 molinari1993 Single state shukla1997 wang2001 sample connor1998 thorpe2001 Subtotal National sample Ov erall FP earns -.49741lower profit 0 Eff ect size % Weight (-0.05, 0.07) ( 0.00, 0.03) ( 0.00, 0.04) ( 0.02, 0.03) ( 0.00, 0.08) 7.7 9.9 9.6 9.9 8.8 0. 06 ( 0.03, 0.08) 0. 28 ( 0.25, 0.32) 0. 06 ( 0.02, 0.11) 9.5 9.0 64.3 0. 06 ( 0.02, 0.09) 100.0 FP earns higher .497418 profit 0. 11 0. 12 0. 19 0. 30 0. 16 Single state sample national==1 rosk o1999 brown2003 rosk o2001b folland2001 National sample koop1997 ozcan1992 zuckerman1994 burgess1996 rosk o2001a Subtotal Ov erall FP is less efficient -.37047 0 Eff ect size 7.4 5.4 6.9 7.0 33.3 -0.17 (-0.20,-0.14) 7.5 -0.12 (-0.16,-0.07) -0.11 (-0.13,-0.09) -0.07 (-0.10,-0.04) 7.3 7.6 7.5 -0.06 (-0.11,-0.02) -0.06 (-0.10,-0.02) -0.06 (-0.11,-0.01) 7.3 7.4 7.3 0. 08 ( 0.05, 0.11) 0. 12 ( 0.08, 0.17) -0.05 (-0.11, 0.01) 7.5 7.3 66.7 0. 02 (-0.04, 0.08) 100.0 FP is more efficient .370474 What Do We Learn? (2) Evidence is pretty conclusive regarding revenue and profit margins Functional forms and analytical methods matter There is little evidence of any difference in cost between FP and NFP hospitals Evidence is mixed regarding efficiency. Single state (Florida) analyses find FP more efficient, national analyses tend to find FP less efficient. 6.5 ( 0.07, 0.15) (-0.03, 0.26) ( 0.11, 0.26) ( 0.24, 0.37) ( 0.08, 0.25) What Do We Learn? (1) Most studies find for-Profits earn more revenue (per admission) and have higher profit margins % Weight Weaker methods and functional forms tend to predict larger differences between not-for-profits and for-profits National samples tend to produce more conservative estimates of effect size than single state analyses 3
