The Effects of Cash and Counseling on Background
advertisement
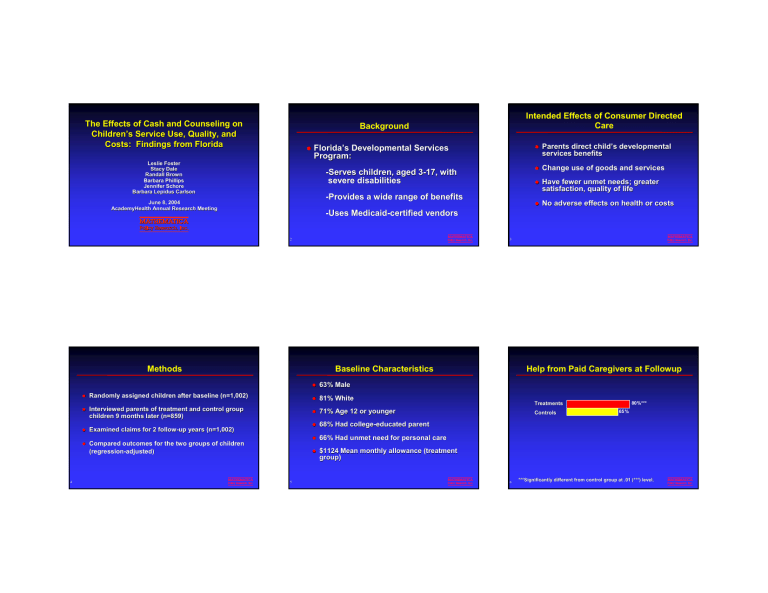
The Effects of Cash and Counseling on Children’s Service Use, Quality, and Costs: Findings from Florida z Florida’s Developmental Services Program: Leslie Foster Stacy Dale Randall Brown Barbara Phillips Jennifer Schore Barbara Lepidus Carlson -Serves children, aged 33-17, with severe disabilities -Provides a wide range of benefits June 8, 2004 AcademyHealth Annual Research Meeting Parents direct child’s developmental services benefits z Change use of goods and services z Have fewer unmet needs; greater satisfaction, quality of life z No adverse effects on health or costs 3 Methods 4 z -Uses MedicaidMedicaid-certified vendors 2 Baseline Characteristics z 63% Male z Randomly assigned children after baseline (n=1,002) z 81% White z Interviewed parents of treatment and control group children 9 months later (n=859) z 71% Age 12 or younger z Examined claims for 2 followfollow-up years (n=1,002) z 68% Had collegecollege-educated parent z 66% Had unmet need for personal care z $1124 Mean monthly allowance (treatment group) z Intended Effects of Consumer Directed Care Background Compared outcomes for the two groups of children (regression(regression-adjusted) 5 Help from Paid Caregivers at Followup Treatments Controls 6 80 %*** 65 % ***Significantly different from control group at .01 (***) level. level. Unmet Needs at Followup Hours of Care at Followup Parents’ Satisfaction at Followup Child has unmet need for: Paid T Unpaid 197 *** 40 *** T C 237 hours Very satisfied with paid caregiver’s schedule (%) Help with household activities (%) 38 *** 55 Total in Past 2 Weeks T C 64 85 *** Care supplies (%) C 30 217 247 hours 26 *** T C Paid caregiver ever neglected child (%) 38 T C Help with personal care (%) 33 *** T C 44 Very satisfied with child’s overall care (%) Routine health care (%) 22 *** T C 7 ***Significantly different from control group at .01 (***) level. level. 8 T C 32 9 ***Significantly different from control group at .01 (***) level. level. Year 1 Policy Implications z CDC/Waiver services ($) T C 27 *** 36 T C 16,000 *** 12,700 18,700 *** 13,900 Contractures developed or worsened (%) 9 *** 14 T C 10 2 T C 4 ***Significantly different from control group at .01 (***) level. level. 6,100 ** 8,300 z Total ($) Child was injured while receiving paid care (%) T C T C 6,400 * 7,900 11 29,800 28,800 From accessaccess-toto-care and quality standpoints, Consumer Directed Care worked well -Reduced unmet needs -Greater satisfaction -Fewer adverse events Home health ($) T C 56 *** Year 2 Child fell (%) T C 27 ***Significantly different from control group at .01 (***) level. level. Annual Medicaid Costs at Followup Adverse Events at Followup 12 *** 25 T C *,**,***Significantly different from control group at .10 (*), .05 (**) (**) or .01 (***) level. 32,800* 30,100 12 Vigilance is needed to contain Medicaid costs
