Document 11603521
advertisement
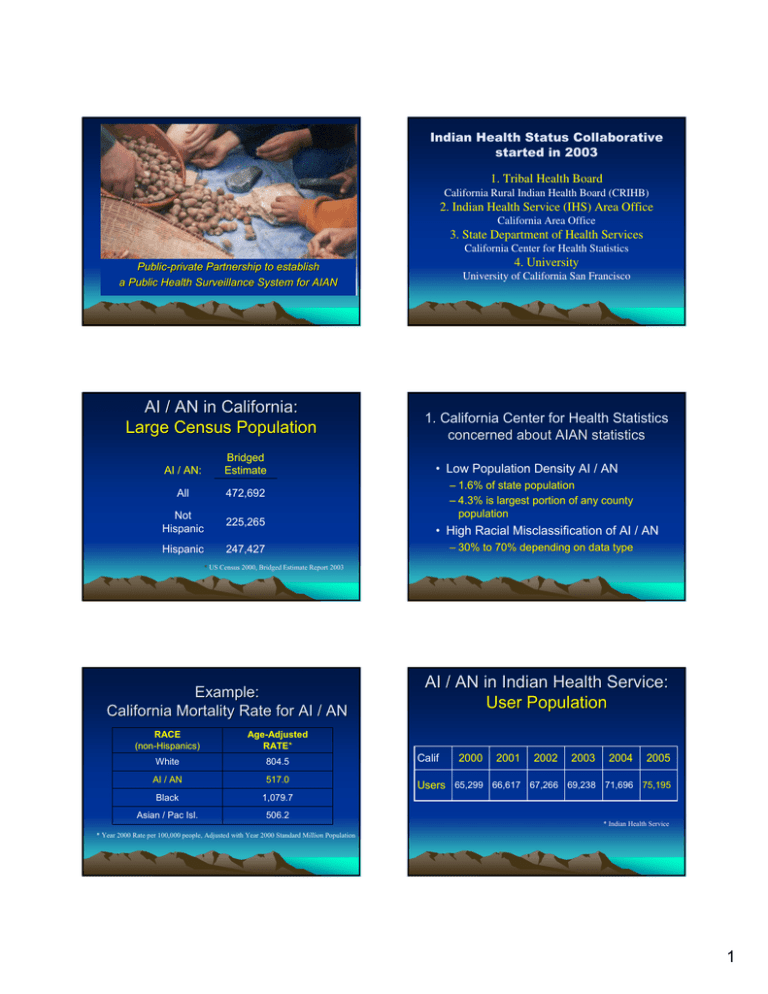
Indian Health Status Collaborative started in 2003 1. Tribal Health Board California Rural Indian Health Board (CRIHB) 2. Indian Health Service (IHS) Area Office California Area Office 3. State Department of Health Services California Center for Health Statistics 4. University PublicPublic-private Partnership to establish a Public Health Surveillance System for AIAN AI / AN in California: Large Census Population AI / AN: Bridged Estimate All 472,692 Not Hispanic 225,265 Hispanic 247,427 University of California San Francisco 1. California Center for Health Statistics concerned about AIAN statistics • Low Population Density AI / AN – 1.6% of state population – 4.3% is largest portion of any county population • High Racial Misclassification of AI / AN – 30% to 70% depending on data type * US Census 2000, Bridged Estimate Report 2003 Example: California Mortality Rate for AI / AN RACE (non-Hispanics) Age-Adjusted RATE* White 804.5 AI / AN 517.0 Black 1,079.7 Asian / Pac Isl. 506.2 AI / AN in Indian Health Service: User Population Calif 2000 2001 2002 2003 2004 2005 Users 65,299 66,617 67,266 69,238 71,696 75,195 * Indian Health Service * Year 2000 Rate per 100,000 people, Adjusted with Year 2000 Standard Million Population 1 2. Tribal Health Board in California concerned about no AIAN data Tribal Health Programs (THP) • Inform IHS funding allocation process Service Areas in – Uses mortality rates by cause (5) – Perception that CA AIAN are healthier 37 of 58 counties • Inform Disparities reduction efforts Tribally owned and operated, – Perception that CA AIAN had no disparities Mainly IHS Funded • Advocate for fair treatment – Evaluate health impact of disparities in funding of California THP The Collaborative Links IHS Data to State Data IHS data identifies AIAN which is then linked to state data bases • Use IHS Active User Population data to identify AIAN AIAN Active Users to Death Certificates to Hospital Discharges to Medicaid to Birth Certificates to Cancer Registry (SEER) to AIDS Registry – Validated Social Security Number (to link) – Other Demographic fields to improve linkage • Link to state health data bases – Deterministic linkage (SSN only) – Probabilistic linkage • Obtain comparable data for Whites Racial Misclassification in State Data California Percent of Records Death Certificates 26% Hospital Discharges 61% Medicaid Birth Certificates Cancer Registry (SEER) AIDS Cases Effect of Racial Misclassification on the Disparity in Death Rates Not Determined AI / AN nonHispanics* White nonHispanics State data 517 805 IHS-State Linked data 1035 858 Rate Ratio [95% C.I.] 0.64 23% In Progress Not Determined 1.21 [1.13,1.29] 2 Hospitalization Disparity Rate Ratios by Cause for THP Service Areas • • • • • • • Diabetes Cardiovascular Disease Asthma Tobacco Alcohol & Drug Cancer Preventable Disparities in Hospitalization Rate Ratios by THP Service Area 2.50 2.00 1.50 1.00 0.50 0.00 H Major Factors in Success • Needs of all three groups are served • Long-term commitment (took 5 years) – No turnover in major players • Consistent commitment – Everyone showed up every time to deal with IRB issues • Follow-through – Findings used in testimony, reports and journal articles produced change in perception and funds V N D L A Q K U E J B O W I P F R C G T M S X Thanks to Collaborative Members: California Rural Indian Health Board (CRIHB) California Area Office the Indian Health services (IHS) of California state Center for Health Statistics (CHS) University of California San Francisco (UCSF), Institute for Health Policy Studies • James Crouch • Margo Kerrigan • James Sutocky • Carol Korenbrot • Chi Kao • Sara Ehlers UC Berkeley: • Karen Garcia* • Sarah Johnson • Matthew Pearn • Sharon Lee 3
