Homework Set #4
advertisement
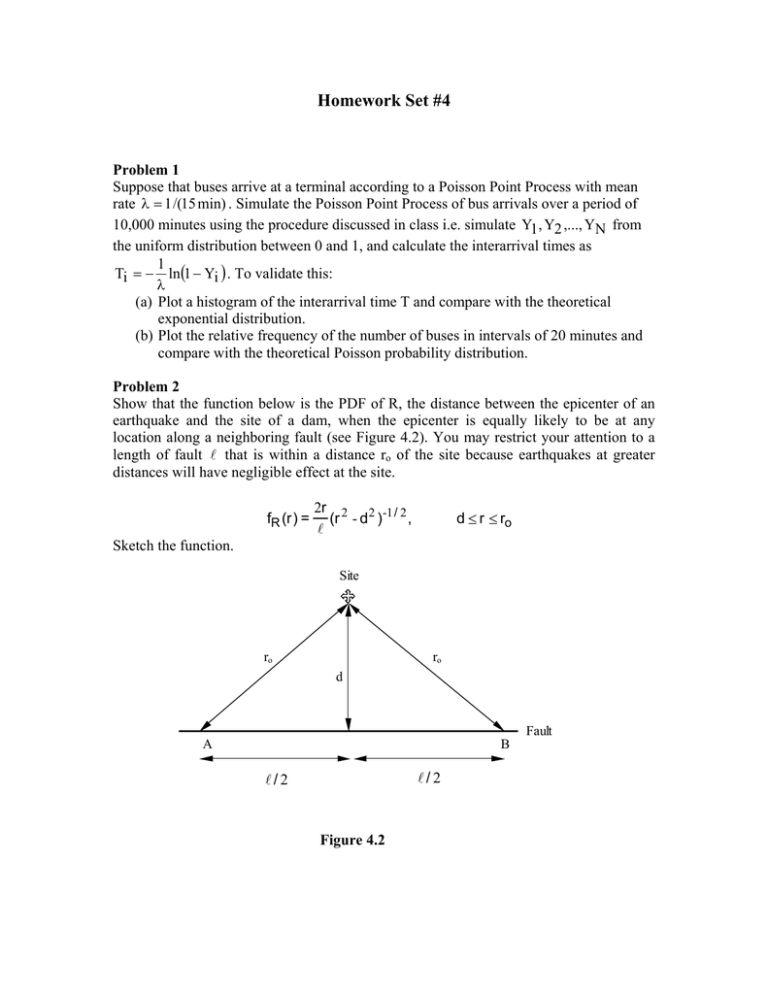
Homework Set #4 Problem 1 Suppose that buses arrive at a terminal according to a Poisson Point Process with mean rate λ = 1 /(15 min) . Simulate the Poisson Point Process of bus arrivals over a period of 10,000 minutes using the procedure discussed in class i.e. simulate Y1 , Y2 ,..., YN from the uniform distribution between 0 and 1, and calculate the interarrival times as 1 Ti = − ln (1 − Yi ) . To validate this: λ (a) Plot a histogram of the interarrival time T and compare with the theoretical exponential distribution. (b) Plot the relative frequency of the number of buses in intervals of 20 minutes and compare with the theoretical Poisson probability distribution. Problem 2 Show that the function below is the PDF of R, the distance between the epicenter of an earthquake and the site of a dam, when the epicenter is equally likely to be at any location along a neighboring fault (see Figure 4.2). You may restrict your attention to a length of fault A that is within a distance ro of the site because earthquakes at greater distances will have negligible effect at the site. fR (r ) = 2r 2 2 -1 / 2 (r - d ) , A d ≤ r ≤ ro Sketch the function. Site ro ro d Fault A B Al/2 /2 Al/2 /2 Figure 4.2 Problem 3 A dam is to be designed to safely retain the water in a reservoir. Let H be the maximum water level in the reservoir in a generic year, and F be the associated horizontal force acting on a 1 meter length of the dam. 1m 10 m F H 6m Figure 4.1 F is related to H as: F = cH 2 = 5 H 2 where H is in meters, and F is in kN Suppose that H has uniform distribution between 6 and 10 meters, so that: ⎧1 ⎪ , fH (h ) = ⎨4 ⎪⎩0, 6 ≤ h ≤ 10 otherwise (a) Find the CDF of F. (b) Assuming that water levels in different years are independent, plot the distribution of the maximum force in 20 years. (c) What practical conclusions on the design value of the horizontal force can you extract from the result in part (b)?
