2000 2010 Number Percent
advertisement
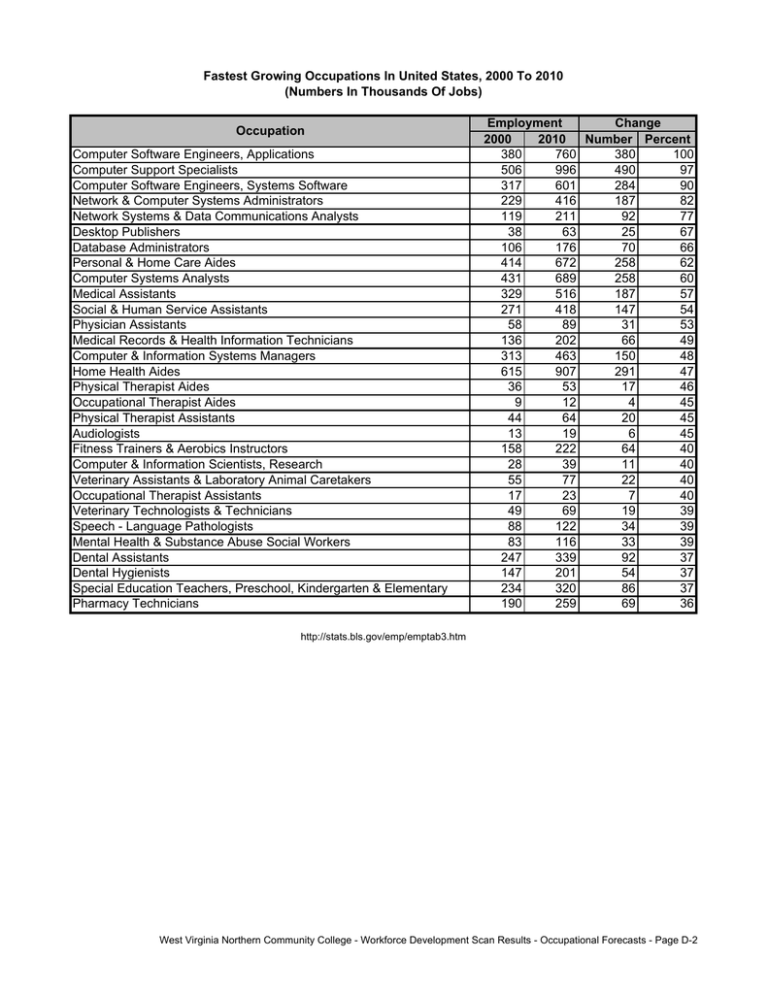
Fastest Growing Occupations In United States, 2000 To 2010 (Numbers In Thousands Of Jobs) Occupation Computer Software Engineers, Applications Computer Support Specialists Computer Software Engineers, Systems Software Network & Computer Systems Administrators Network Systems & Data Communications Analysts Desktop Publishers Database Administrators Personal & Home Care Aides Computer Systems Analysts Medical Assistants Social & Human Service Assistants Physician Assistants Medical Records & Health Information Technicians Computer & Information Systems Managers Home Health Aides Physical Therapist Aides Occupational Therapist Aides Physical Therapist Assistants Audiologists Fitness Trainers & Aerobics Instructors Computer & Information Scientists, Research Veterinary Assistants & Laboratory Animal Caretakers Occupational Therapist Assistants Veterinary Technologists & Technicians Speech - Language Pathologists Mental Health & Substance Abuse Social Workers Dental Assistants Dental Hygienists Special Education Teachers, Preschool, Kindergarten & Elementary Pharmacy Technicians Employment Change 2000 2010 Number Percent 380 760 380 100 506 996 490 97 317 601 284 90 229 416 187 82 119 211 92 77 38 63 25 67 106 176 70 66 414 672 258 62 431 689 258 60 329 516 187 57 271 418 147 54 58 89 31 53 136 202 66 49 313 463 150 48 615 907 291 47 36 53 17 46 9 12 4 45 44 64 20 45 13 19 6 45 158 222 64 40 28 39 11 40 55 77 22 40 17 23 7 40 49 69 19 39 88 122 34 39 83 116 33 39 247 339 92 37 147 201 54 37 234 320 86 37 190 259 69 36 http://stats.bls.gov/emp/emptab3.htm West Virginia Northern Community College - Workforce Development Scan Results - Occupational Forecasts - Page D-2 Occupations With The Largest Job Growth In United States, 2000 To 2010 (Numbers In Thousands Of Jobs) Occupation Combined Food Preparation & Serving Workers, including Fast Food Customer Service Representatives Registered Nurses Retail Salespersons Computer Support Specialists Cashiers, except Gaming Office Clerks, General Security Guards Computer Software Engineers, Applications Waiters & Waitresses Employment Change 2000 2010 Number Percent 2,206 2,879 673 30 1,946 2,577 631 32 2,194 2,755 561 26 4,109 4,619 510 12 506 996 490 97 3,325 3,799 474 14 2,705 3,135 430 16 1,106 1,497 391 35 380 760 380 100 1,983 2,347 364 18 http://stats.bls.gov/news.release/ecopro.t07.htm West Virginia Northern Community College - Workforce Development Scan Results - Occupational Forecasts - Page D-3 Industries With The Fastest Wage And Salary Employment Growth In United States, 2000 To 2010 Industry Description Computer & Data Processing Services Residential Care Health Services, N.E.C. Cable & Pay Television Services Personnel Supply Services Warehousing & Storage Water & Sanitation Miscellaneous Business Services Miscellaneous Equipment Rental & Leasing Management & Public Relations Average Annual Employment Change Rate Of Change 2000 2010 2000-2010 2000-2010 2,095 3,900 1,805 6.4 806 1,318 512 5.0 1,210 1,900 690 4.6 216 325 109 4.2 3,887 5,800 1,913 4.1 206 300 94 3.8 214 310 96 3.8 2,301 3,305 1,004 3.7 279 397 118 3.6 1,090 1,550 460 3.6 http://stats.bls.gov/news.release/ecopro.t03.htm West Virginia Northern Community College - Workforce Development Scan Results - Occupational Forecasts - Page D-4 Employment By Major Industry In United States, Actual And Projected, 1990 To 2010 Industry Nonfarm Wage & Salary Goods Producing Mining Construction Manufacturing Durable Nondurable Service Producing Transportation, Communications, Utilities Wholesale Trade Retail Trade Finance, Insurance & Real Estate Services Government Federal Government State & Local Government Agriculture Private Household Wage & Salary Nonagriculture Self-Employed & Unpaid Family Workers Thousands Of Jobs Change 2010 1990-2000 2000-2010 152,447 21,879 21,807 27,057 803 1,347 488 –167 –55 7,522 1,578 825 19,047 –607 577 11,780 29 642 7,267 –637 –64 125,390 21,076 20,461 Average Annual Rate Of Change 1990-2000 2000-2010 1.8 1.6 0.3 0.5 –2.6 –1.1 2.7 1.2 –0.3 0.3 0.0 0.6 –0.8 –0.1 2.3 1.8 1990 108,760 24,906 709 5,120 19,077 11,109 7,968 83,854 2000 130,639 25,709 543 6,698 18,469 11,138 7,331 104,930 5,776 6,173 19,601 7,019 7,024 23,307 8,274 7,800 26,400 1,243 851 3,706 1,255 776 3,093 2.0 1.3 1.7 1.7 1.1 1.3 6,709 27,291 18,304 3,085 15,219 3,340 7,560 39,340 20,680 2,777 17,903 3,526 8,247 52,233 22,436 2,622 19,814 3,849 851 12,049 2,376 –308 2,684 186 687 12,893 1,757 –154 1,911 323 1.2 3.7 1.2 –1.0 1.6 0.5 0.9 2.9 0.8 –0.6 1.0 0.9 1,014 890 664 –124 –226 –1.3 –2.9 8,921 8,731 9,062 –190 331 –0.2 0.4 http://www.bls.gov/opub/mlr/2001/11/art3full.pdf West Virginia Northern Community College - Workforce Development Scan Results - Occupational Forecasts - Page D-5 Percent Distribution Of Wage And Salary Employment By Major Industry Division In United States, 1990 To 2010 Industry Nonfarm Wage & Salary Goods Producing Mining Construction Manufacturing Durable Nondurable Service Producing Transportation, Communications, Utilities Wholesale Trade Retail Trade Finance, Insurance & Real Estate Services Government Federal Government State & Local Government Agriculture Private Household Wage & Salary Nonagriculture Self-Employed & Unpaid Family Workers 1990 87.5 20.0 0.6 4.1 15.3 8.9 6.4 67.4 4.6 5.0 15.8 5.4 22.0 14.7 2.5 12.2 2.7 0.8 7.2 2000 89.7 17.7 0.4 4.6 12.7 7.7 5.0 72.1 4.8 4.8 16.0 5.2 27.0 14.2 1.9 12.3 2.4 0.6 6.0 2010 90.9 16.1 0.3 4.5 11.4 7.0 4.3 74.7 4.9 4.6 15.7 4.9 31.1 13.4 1.6 11.8 2.3 0.4 5.4 http://www.bls.gov/opub/mlr/2001/11/art3full.pdf West Virginia Northern Community College - Workforce Development Scan Results - Occupational Forecasts - Page D-6 Employment By Major Occupational Group In United States, 2000 And Projected 2010 (Numbers In Thousand Of Jobs) Occupational Group Total, All Occupations Management, Business & Financial Occupations Professional & Related Occupations Service Occupations Sales & Related Occupations Office & Administrative Support Occupations Farming, Fishing & Forestry Occupations Construction & Extraction Occupations Installation, Maintenance & Repair Occupations Production Occupations Transportation & Material Moving Occupations Employment Change Number Percent Distribution Number Percent 2000 2010 2000 2010 2000-2010 2000-2010 145,594 167,754 100.00 100.00 22,160 15.20 15,519 26,758 26,075 15,513 17,635 33,709 31,163 17,365 10.70 18.40 17.90 10.70 10.50 20.10 18.60 10.40 2,115 6,952 5,088 1,852 13.60 26.00 19.50 11.90 23,882 26,053 16.40 15.50 2,171 9.10 1,429 7,451 1,480 8,439 1.00 5.10 0.90 5.00 51 989 3.60 13.30 5,820 13,060 6,482 13,811 4.00 9.00 3.90 8.20 662 750 11.40 5.70 10,088 11,618 6.90 6.90 1,530 15.20 http://stats.bls.gov/emp/emptab1.htm West Virginia Northern Community College - Workforce Development Scan Results - Occupational Forecasts - Page D-7 Fastest Growing Occupations In West Virginia, 2002 To 2012 Occupation Medical Assistants Social & Human Service Assistants Physical Therapist Assistants Computer Software Engineers, Applications Cardiovascular Technologists & Technicians Respiratory Therapy Technicians Physical Therapist Aides Respiratory Therapists Physician Assistants Medical Records & Health Information Technicians Computer Software Engineers, Systems Software Personal & Home Care Aides Network Systems & Data Communications Analysts Physical Therapists Radiation Therapists Surgical Technologists Veterinary Technologists & Technicians Dental Hygienists Home Health Aides Occupational Therapists Personal Financial Advisors Dental Assistants Medical & Public Health Social Workers Audiologists Hazardous Materials Removal Workers Employment Average Annual Openings 2002 2012 Growth Replacement Total 1,492 2,204 71 28 99 2,765 3,894 113 49 162 441 620 18 7 25 852 1,188 34 8 42 404 559 16 8 23 190 263 7 3 10 345 475 13 6 19 952 1,310 36 31 67 472 646 17 7 25 993 1,339 35 14 49 317 424 11 3 14 4,937 6,592 166 79 245 643 838 20 8 27 1,045 1,357 31 10 42 91 118 3 2 5 489 631 14 6 21 258 332 7 3 11 656 841 19 6 24 4,999 6,399 140 66 206 273 349 8 4 11 253 323 7 3 10 628 801 17 18 35 978 1,243 27 17 43 56 71 2 1 3 188 238 5 5 10 http://www.wvbep.org/bep/lmi/occproj/OPMENU.HTM West Virginia Northern Community College - Workforce Development Scan Results - Occupational Forecasts - Page D-8 Growth Rate 4.77% 4.08% 4.06% 3.94% 3.84% 3.84% 3.77% 3.76% 3.69% 3.48% 3.38% 3.35% 3.03% 2.99% 2.97% 2.90% 2.87% 2.82% 2.80% 2.78% 2.77% 2.75% 2.71% 2.68% 2.66% West Virginia Northern Community College - Workforce Development Scan Results - Occupational Forecasts - Page D-9 Occupations With The Largest Job Growth In West Virginia, 2002 To 2012 Occupation Cashiers Combined Food Preparation & Serving Workers, including Fast Food Retail Salespersons Registered Nurses Waiters & Waitresses Laborers & Freight, Stock & Hand Material Movers Office Clerks, General Janitors & Cleaners, except Maids & Housekeeping Cleaners General & Operations Managers Nursing Aides, Orderlies, & Attendants Stock Clerks & Order Fillers Secretaries, except Legal, Medical, & Executive Truck Drivers, Heavy & Tractor-Trailer Personal & Home Care Aides Customer Service Representatives Licensed Practical & Licensed Vocational Nurses Maids & Housekeeping Cleaners Receptionists & Information Clerks Maintenance & Repair Workers, General Home Health Aides First-Line Supervisors/ Managers of Retail Sales Workers Sales Representatives, Wholesale & Manufacturing, except Technical & Scientific Products Bookkeeping, Accounting & Auditing Clerks Tellers Child Care Workers Average Annual Openings Growth Growth Replacement Total Rate 21,430 22,438 101 1,043 1,143 0.47% 2002 2012 15,685 20,272 16,852 11,242 18,898 21,499 21,087 12,936 321 123 424 169 680 737 353 578 1,001 860 776 748 2.05% 0.61% 2.51% 1.51% 13,283 12,035 17,365 17,395 0 3 434 385 434 388 -0.94% 0.02% 12,798 13,657 12,368 13,287 10,312 12,163 7,701 6,823 86 92 185 0 243 233 135 285 329 325 320 285 0.67% 0.74% 1.80% -1.14% 14,168 12,841 11,453 12,181 4,937 6,592 7,454 8,661 0 73 166 121 271 187 79 111 271 260 245 232 -0.94% 0.64% 3.35% 1.62% 7,779 8,105 6,105 8,670 6,399 74 72 85 54 140 153 155 129 156 66 228 227 214 210 206 1.06% 0.98% 1.61% 0.67% 2.80% 10,669 10,747 8 192 200 0.07% 5,195 5,808 10,479 10,005 3,877 3,891 5,653 6,024 61 0 1 37 136 196 191 154 198 196 192 191 1.18% -0.45% 0.04% 0.66% 7,036 7,383 5,258 8,127 4,999 http://www.wvbep.org/bep/lmi/occproj/OPMENU.HTM West Virginia Northern Community College - Workforce Development Scan Results - Occupational Forecasts - Page D-10 Fastest Growing Occupations In Workforce Investment Area 5, 2002 To 2012 (Includes Brooke, Hancock, Marshall, Ohio, Tyler and Wetzel Counties) Occupation Medical Assistants Social & Human Service Assistants Cardiovascular Technologists & Technicians Respiratory Therapy Technicians Home Health Aides Respiratory Therapists Dental Assistants Dental Hygienists Medical Records & Health Information Technicians Network Systems & Data Communications Analysts Computer Software Engineers, Applications Pharmacists Life, Physical & Social Science Technicians, All Other Pharmacy Technicians Surgical Technologists Personal & Home Care Aides Medical & Health Services Managers Database Administrators Teachers, Primary, Secondary & Adult, All Other (OES Only) Registered Nurses Physical Therapists Business Teachers, Postsecondary Network & Computer Systems Administrators Interviewers, except Eligibility & Loan English Language & Literature Teachers, Postsecondary Employment Average Annual Openings Growth 2002 2012 Growth Replacement Total Rate 113 166 5 2 7 4.69% 566 798 23 10 33 4.10% 36 50 1 1 2 3.89% 44 61 2 1 2 3.86% 451 623 17 6 23 3.81% 121 166 5 4 9 3.72% 111 148 4 3 7 3.33% 137 180 4 1 6 3.14% 101 132 3 1 5 3.07% 49 64 2 1 2 3.06% 71 92 2 1 3 2.96% 111 143 3 2 5 2.88% 42 54 1 1 2 2.86% 99 127 3 1 4 2.83% 54 69 2 1 2 2.78% 234 296 6 4 10 2.65% 117 147 3 2 5 2.56% 41 51 1 0 1 2.44% 62 77 2,175 2,698 62 76 40 49 76 93 49 60 41 2 52 1 1 2 1 1 46 1 1 1 1 2 98 2 2 3 2 2.42% 2.40% 2.26% 2.25% 2.24% 2.24% 1 1 2 2.20% 50 http://www.wvbep.org/bep/lmi/occproj/OPMENU.HTM West Virginia Northern Community College - Workforce Development Scan Results - Occupational Forecasts - Page D-11 Occupations With The Largest Job Growth In Workforce Investment Area 5, 2002 To 2012 (Includes Brooke, Hancock, Marshall, Ohio, Tyler and Wetzel Counties) Occupation 2002 Cashiers Registered Nurses Combined Food Preparation & Serving Workers, including Fast Food Retail Salespersons Laborers & Freight, Stock & Material Movers, Hand Waiters & Waitresses Janitors & Cleaners, except Maids & Housekeeping Cleaners Social & Human Service Assistants 2,129 2,175 Average Annual Openings Growth Growth Replacement Total Rate 2,090 0 104 104 -0.18% 2,698 52 46 98 2.40% 1,533 1,366 1,742 1,557 21 19 66 50 87 69 1.36% 1.40% 1,652 897 1,420 964 0 7 54 46 54 53 -1.40% 0.75% 1,623 566 1,712 798 9 23 31 10 40 33 0.55% 4.10% Licensed Practical & Licensed Vocational Nurses 999 Office Clerks, General 1,387 1,103 1,398 10 1 22 31 32 32 1.04% 0.08% Secretaries, except Legal, Medical & Executive Stock Clerks & Order Fillers General & Operations Managers Food Preparation Workers Child Care Workers Home Health Aides Tellers Nursing Aides, Orderlies & Attendants Maids & Housekeeping Cleaners Carpenters Chemical Plant & System Operators Bartenders Bookkeeping, Accounting & Auditing Clerks Receptionists & Information Clerks Maintenance & Repair Workers, General 1,418 687 1,181 688 778 623 425 1,047 743 1,014 456 463 967 554 810 0 0 6 4 5 17 0 9 6 4 0 0 0 7 3 30 29 21 23 20 6 22 13 14 16 20 19 19 12 15 30 29 28 27 25 23 22 21 20 20 20 19 19 19 18 -0.79% -1.34% 0.57% 0.67% 0.75% 3.81% -0.43% 0.88% 0.83% 0.41% -2.78% -0.29% -0.58% 1.47% 0.34% 1,539 793 1,117 645 724 451 444 962 686 974 632 477 1,027 483 783 2012 http://www.wvbep.org/bep/lmi/occproj/OPMENU.HTM West Virginia Northern Community College - Workforce Development Scan Results - Occupational Forecasts - Page D-12
