Bloomsburg University TOTAL UNDERGRADUATE ENROLLMENT BY RACE FALL SEMESTERS, 2004 THROUGH 2013 American
advertisement
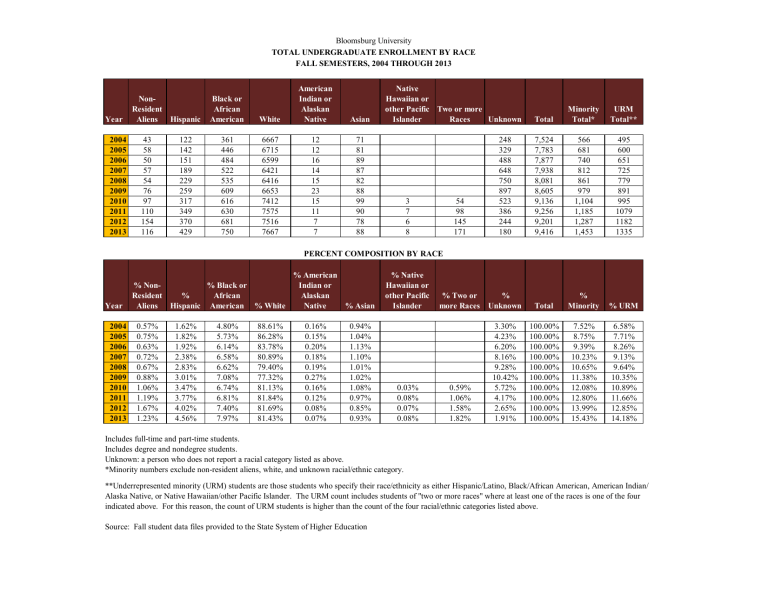
Bloomsburg University TOTAL UNDERGRADUATE ENROLLMENT BY RACE FALL SEMESTERS, 2004 THROUGH 2013 Year 2004 2005 2006 2007 2008 2009 2010 2011 2012 2013 NonResident Aliens Hispanic 43 58 50 57 54 76 97 110 154 116 122 142 151 189 229 259 317 349 370 429 Black or African American 361 446 484 522 535 609 616 630 681 750 White American Indian or Alaskan Native Asian 6667 6715 6599 6421 6416 6653 7412 7575 7516 7667 12 12 16 14 15 23 15 11 7 7 71 81 89 87 82 88 99 90 78 88 Native Hawaiian or other Pacific Two or more Islander Races Unknown Total Minority Total* URM Total** 54 98 145 171 248 329 488 648 750 897 523 386 244 180 7,524 7,783 7,877 7,938 8,081 8,605 9,136 9,256 9,201 9,416 566 681 740 812 861 979 1,104 1,185 1,287 1,453 495 600 651 725 779 891 995 1079 1182 1335 % Two or more Races % Unknown Total % Minority % URM 0.59% 1.06% 1.58% 1.82% 3.30% 4.23% 6.20% 8.16% 9.28% 10.42% 5.72% 4.17% 2.65% 1.91% 100.00% 100.00% 100.00% 100.00% 100.00% 100.00% 100.00% 100.00% 100.00% 100.00% 7.52% 8.75% 9.39% 10.23% 10.65% 11.38% 12.08% 12.80% 13.99% 15.43% 6.58% 7.71% 8.26% 9.13% 9.64% 10.35% 10.89% 11.66% 12.85% 14.18% 3 7 6 8 PERCENT COMPOSITION BY RACE Year 2004 2005 2006 2007 2008 2009 2010 2011 2012 2013 % Black or % NonAfrican Resident % Aliens Hispanic American % White 0.57% 0.75% 0.63% 0.72% 0.67% 0.88% 1.06% 1.19% 1.67% 1.23% 1.62% 1.82% 1.92% 2.38% 2.83% 3.01% 3.47% 3.77% 4.02% 4.56% 4.80% 5.73% 6.14% 6.58% 6.62% 7.08% 6.74% 6.81% 7.40% 7.97% 88.61% 86.28% 83.78% 80.89% 79.40% 77.32% 81.13% 81.84% 81.69% 81.43% % American Indian or Alaskan Native % Asian 0.16% 0.15% 0.20% 0.18% 0.19% 0.27% 0.16% 0.12% 0.08% 0.07% 0.94% 1.04% 1.13% 1.10% 1.01% 1.02% 1.08% 0.97% 0.85% 0.93% % Native Hawaiian or other Pacific Islander 0.03% 0.08% 0.07% 0.08% Includes full-time and part-time students. Includes degree and nondegree students. Unknown: a person who does not report a racial category listed as above. *Minority numbers exclude non-resident aliens, white, and unknown racial/ethnic category. **Underrepresented minority (URM) students are those students who specify their race/ethnicity as either Hispanic/Latino, Black/African American, American Indian/ Alaska Native, or Native Hawaiian/other Pacific Islander. The URM count includes students of "two or more races" where at least one of the races is one of the four indicated above. For this reason, the count of URM students is higher than the count of the four racial/ethnic categories listed above. Source: Fall student data files provided to the State System of Higher Education
