Document 11481400
advertisement
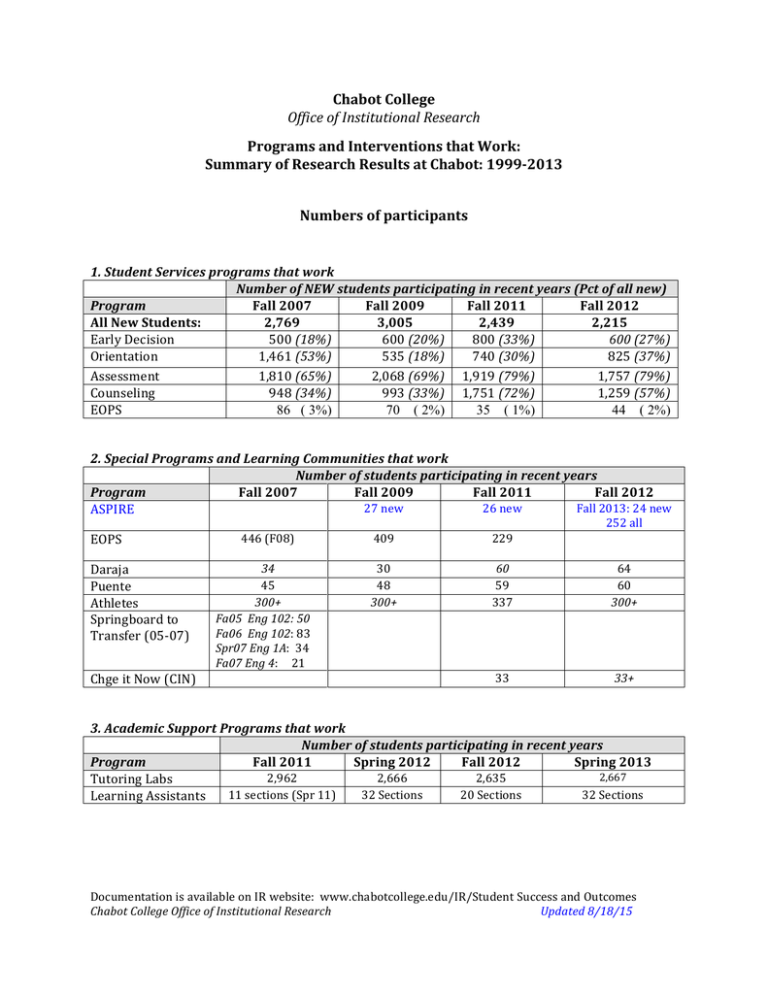
Chabot College Office of Institutional Research Programs and Interventions that Work: Summary of Research Results at Chabot: 1999-­‐2013 Numbers of participants 1. Student Services programs that work Number of NEW students participating in recent years (Pct of all new) Program Fall 2007 Fall 2009 Fall 2011 Fall 2012 All New Students: 2,769 3,005 2,439 2,215 Early Decision 500 (18%) 600 (20%) 800 (33%) 600 (27%) Orientation 1,461 (53%) 535 (18%) 740 (30%) 825 (37%) Assessment 1,810 (65%) 2,068 (69%) 1,919 (79%) 1,757 (79%) Counseling 948 (34%) 993 (33%) 1,751 (72%) 1,259 (57%) EOPS 86 ( 3%) 70 ( 2%) 35 ( 1%) 44 ( 2%) 2. Special Programs and Learning Communities that work Number of students participating in recent years Program Fall 2007 Fall 2009 Fall 2011 Fall 2012 27 new 26 new Fall 2013: 24 new ASPIRE EOPS Daraja Puente Athletes Springboard to Transfer (05-­‐07) 446 (F08) 34 45 300+ Fa05 Eng 102: 50 Fa06 Eng 102: 83 Spr07 Eng 1A: 34 Fa07 Eng 4: 21 229 60 59 337 409 30 48 300+ 252 all 64 60 300+ 33 33+ Chge it Now (CIN) 3. Academic Support Programs that work Number of students participating in recent years Program Fall 2011 Spring 2012 Fall 2012 Spring 2013 2,667 2,962 2,666 2,635 Tutoring Labs 32 Sections 20 Sections 32 Sections Learning Assistants 11 sections (Spr 11) Documentation is available on IR website: www.chabotcollege.edu/IR/Student Success and Outcomes Chabot College Office of Institutional Research Updated 8/18/15 4. Academic Programs, Courses, and Interventions that work Number of students participating in recent years Program/Course Fall 2007 Fall 2009 Fall 2011 Fall 2012 Basic Skills instruction in Context: 185 Reading Apprenticeship 89 History 27 Supplemental Instruction (SI) 40+ Psychology Supplemental Instruction (SI) 663 841 894 878 Accelerated English 102 472/148 426/193 281/175 359/169 English 101A/B 930 880 871 926 English 1A 115/75 104/50 87/60 98/67 ESL 110C / 110D 5. Student Characteristics and behaviors that are associated with progress and completion Number of students in recent years Student Chars Fall 2007 Fall 2009 Fall 2011 Fall 2012 7,374 7,211 Ed goal-­‐Transfer 2,682 2,444 Ed goal-­‐Undecided 4,522 4,419 Attend Full-­‐time 2,316 2,173 Asian American 1,193 1,082 Filipino Out of total number of new students Student Chars All New 2,769 3,005 2,439 2,215 Students: 443 (16%) 361 (12%) 390 (16%) 421 (19%) New Students: Assess into College English New Students: Assess into College Math Laser FT College-­‐Ready Laser FT Basic Skills Seeker PT College-­‐Ready Started Chabot same year as HS graduation Not repeating a class 498 (18%) 361 (12%) 341 (14%) 377 (17%) 151 (5%) 92 (4%) 169 (8%) 472 (16%) 330 (14%) 460 (21%) 77 (3%) 85 (3%) 105 (5%) 1,360 (45%) 1,408 (58%) 1,297 (47%) Documentation is available on IR website: www.chabotcollege.edu/IR/Student Success and Outcomes Chabot College Office of Institutional Research Updated 8/18/15
