GEF4320 Radiation and Remote Sensing 1) Visit at ALOMAR
advertisement
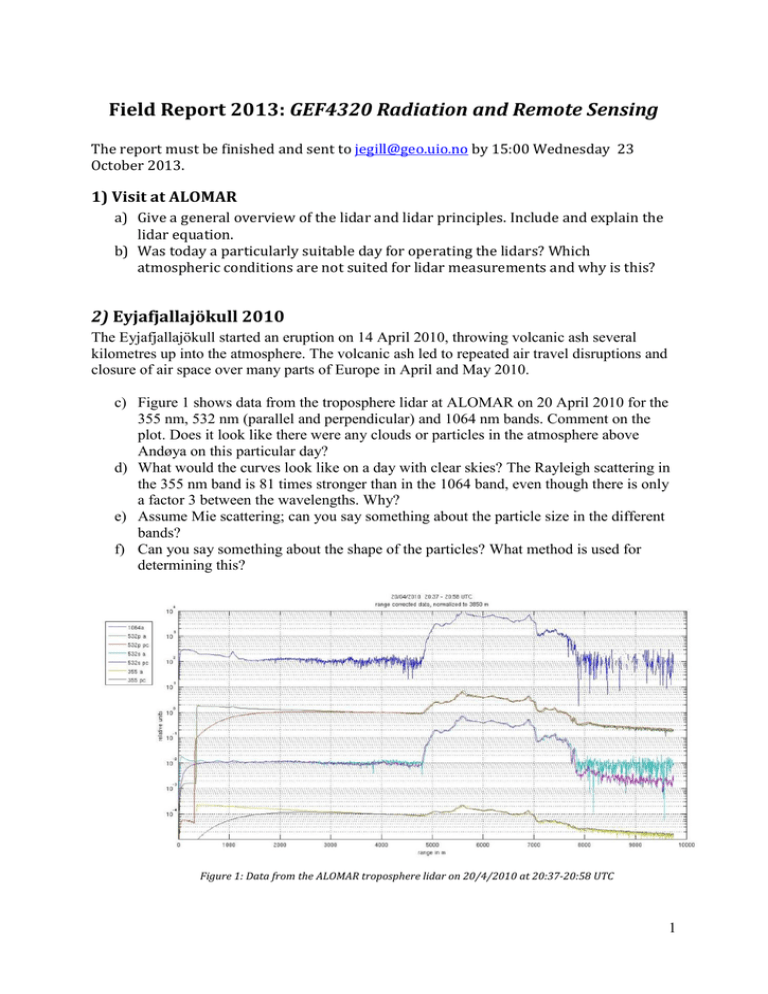
Field Report 2013: GEF4320 Radiation and Remote Sensing The report must be finished and sent to jegill@geo.uio.no by 15:00 Wednesday 23 October 2013. 1) Visit at ALOMAR a) Give a general overview of the lidar and lidar principles. Include and explain the lidar equation. b) Was today a particularly suitable day for operating the lidars? Which atmospheric conditions are not suited for lidar measurements and why is this? 2) Eyjafjallajökull 2010 The Eyjafjallajökull started an eruption on 14 April 2010, throwing volcanic ash several kilometres up into the atmosphere. The volcanic ash led to repeated air travel disruptions and closure of air space over many parts of Europe in April and May 2010. c) Figure 1 shows data from the troposphere lidar at ALOMAR on 20 April 2010 for the 355 nm, 532 nm (parallel and perpendicular) and 1064 nm bands. Comment on the plot. Does it look like there were any clouds or particles in the atmosphere above Andøya on this particular day? d) What would the curves look like on a day with clear skies? The Rayleigh scattering in the 355 nm band is 81 times stronger than in the 1064 band, even though there is only a factor 3 between the wavelengths. Why? e) Assume Mie scattering; can you say something about the particle size in the different bands? f) Can you say something about the shape of the particles? What method is used for determining this? Figure 1: Data from the ALOMAR troposphere lidar on 20/4/2010 at 20:37-20:58 UTC 1 g) Figure 2 shows the same measurements approx. 2 hours later. Comment on the plot. Figure 2: Data from the ALOMAR troposphere lidar on 20/4/2010 at 22:48-23:09 UTC h) The time evolutions for the 1064 nm and the 532 nm bands are shown in figure 3. Describe the time evolutions and compare with the previous plots. 2 Figure 3: Data from the 1064 nm and the 532 nm channels. i) Figure 4 shows data from the ceilometer at NAROM. Can you say something about the weather conditions on this particular day? Compare with the previous plots and with the radiosonde sounding from Bodø (station 01152). Is the sounding helpful in order to determine the origin of the particles? 3 Figure 4: Data from the Andøya ceilometer (at 1064 nm) at 20/4/2010. j) Based on these measurements, a model calculation was made with a backward trajectory model (HYSPLIT) to study where the measured particles could come from. In the model, particles in 3 different altitudes (7000-6000-5000m) were ‘released’ at Andøya and the model was run backwards for 144 hrs (with meteorological data from that period). The calculations are shown in the figure below. Does it look like the particles could have been volcanic ash? 4


