Why Conduct Pilot Studies for Agitated Gas-Liquid Mass Transfer? facilities and euipment
advertisement

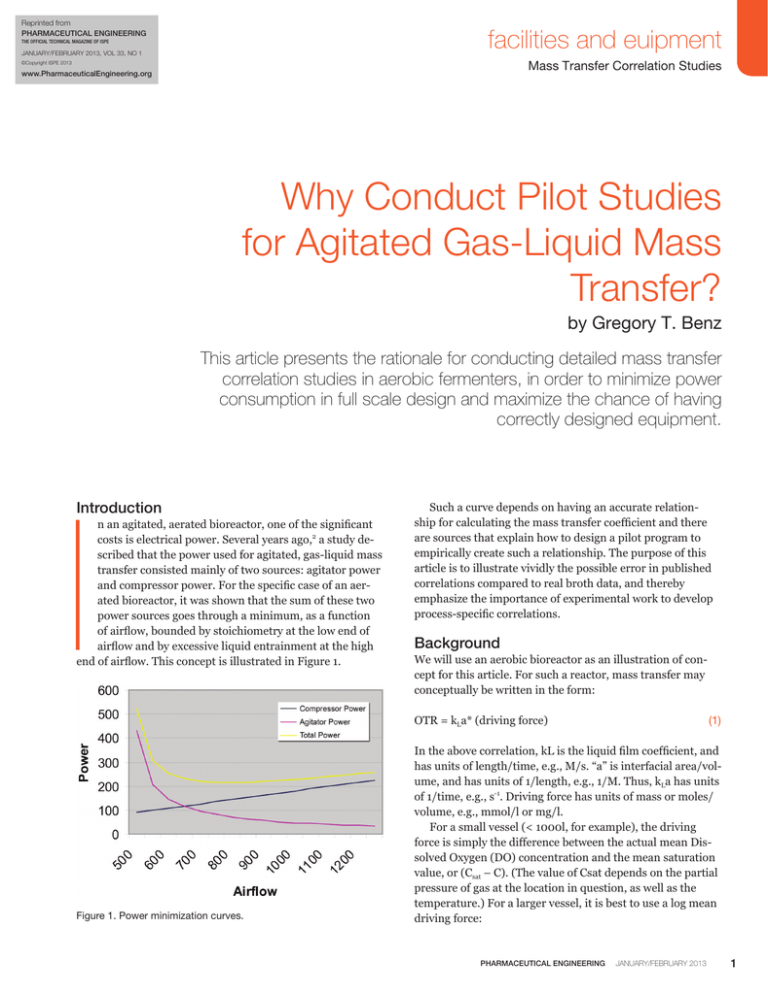
Reprinted from PHARMACEUTICAL ENGINEERING facilities and euipment The Official Technical Magazine of ISPE January/February 2013, Vol 33, No 1 Mass Transfer Correlation Studies ©Copyright ISPE 2013 www.PharmaceuticalEngineering.org Why Conduct Pilot Studies for Agitated Gas-Liquid Mass Transfer? by Gregory T. Benz This article presents the rationale for conducting detailed mass transfer correlation studies in aerobic fermenters, in order to minimize power consumption in full scale design and maximize the chance of having correctly designed equipment. I Introduction n an agitated, aerated bioreactor, one of the significant costs is electrical power. Several years ago,2 a study described that the power used for agitated, gas-liquid mass transfer consisted mainly of two sources: agitator power and compressor power. For the specific case of an aerated bioreactor, it was shown that the sum of these two power sources goes through a minimum, as a function of airflow, bounded by stoichiometry at the low end of airflow and by excessive liquid entrainment at the high end of airflow. This concept is illustrated in Figure 1. Such a curve depends on having an accurate relationship for calculating the mass transfer coefficient and there are sources that explain how to design a pilot program to empirically create such a relationship. The purpose of this article is to illustrate vividly the possible error in published correlations compared to real broth data, and thereby emphasize the importance of experimental work to develop process-specific correlations. Background We will use an aerobic bioreactor as an illustration of concept for this article. For such a reactor, mass transfer may conceptually be written in the form: (1) OTR = kLa* (driving force) Figure 1. Power minimization curves. In the above correlation, kL is the liquid film coefficient, and has units of length/time, e.g., M/s. “a” is interfacial area/volume, and has units of 1/length, e.g., 1/M. Thus, kLa has units of 1/time, e.g., s-1. Driving force has units of mass or moles/ volume, e.g., mmol/l or mg/l. For a small vessel (< 1000l, for example), the driving force is simply the difference between the actual mean Dissolved Oxygen (DO) concentration and the mean saturation value, or (Csat – C). (The value of Csat depends on the partial pressure of gas at the location in question, as well as the temperature.) For a larger vessel, it is best to use a log mean driving force: PHARMACEUTICAL ENGINEERING January/February 2013 1 facilities and equipment Mass Transfer Correlation Studies (Csat – C)in – (Csat – C)out log mean = _____________________ driving force ln ((Csat – C)in / (Csat – C)out) (2) Thus, if driving force and kLa are known, the mass transfer rate is easily determined. But how is this kLa calculated? Though many different forms of correlation have been used in the literature, the most common form is: kLa = A(P/V)b(Us)c (3) The constants, A, B and C, must be experimentally determined for the specific gas-liquid system in question. They may depend on the actual magnitudes of P/V and Us, and possibly on impeller type and scale of equipment, as well as the chemical composition and physical properties of the gas and liquid. For these reasons, it is important to try not to extrapolate the correlation beyond the range over which it was developed. The dimensions of “A” depend on the units used; it is not a dimensionless number. Several such correlations have been published in the literature. The works of many others were summarized4 by dividing their data into coalescing systems (essentially tap or distilled water) and non-coalescing systems (essentially water with high ionic strength, as would be expected of fermenters with a nutrient solution as the broth.) Later, an “average” correlation for an air-water system was published.1 These authors note that such correlations are generally no more than ± 30% accurate. This author has worked with various clients over the years to design experimental programs and interpret the results for specific broths. A couple of these will be used in this article, called simply broth 1 and broth 2. These two broths differ markedly from the published correlations, as can be seen in Table A. • • • • • • • • • • • • • • • • Tank diameter : 5 M Liquid volume: 229000 l Ungassed liquid level: 12 M Temperature: 37°C Feed gas: air, at 21% oxygen Csat at 21% oxygen, 1 atmosphere: 7.2 mg/l DO at bottom of vessel: 2 mg/l DO at top of vessel: 1 mg/l Backpressure: 0.3 bar Barometric pressure: 1 atm or 760 torr Moles of CO2 respired per mole of oxygen consumed: 0.95 Liquid density: 1000 g/l Total gas line pressure losses: 1.5 bar Compressor efficiency: 70% Agitator mechanical efficiency: 95% Design OTR: 150 mmol-l-h The total power (agitator plus compressor) has been plotted in Figure 2 as a function of airflow in a series of curves representing each of the kLa correlations in Table A. Full Scale Example To illustrate the consequences of different kLa correlations, the total power as a function of airflow was calculated using the methods2 for the following specific production bioreactor data and assumptions: Mass Transfer Correlation Constants A B C Bakker (1) 0.946 0.6 0.6 Coalescing (4) 0.41 0.4 0.5 Non-coalescing (4) 0.25 0.7 0.2 Broth 1 0.67 0.55 0.6 Broth 2 3.73 0.542 0.741 Table A. Typical constants used in mass transfer correlations. 2 January/February 2013 PHARMACEUTICAL ENGINEERING Figure 2. The total power (agitator plus compressor). facilities and euipment Mass Transfer Correlation Studies Discussion of Results As can be seen, even the published correlations can differ from each other by a factor of 3 or more. Actual broths can deviate significantly from each other as well as published correlations. One could easily be seriously in error if the wrong correlation is used for design. In one direction, the wrong correlation can waste money by installing massively oversized equipment and using excessive power. An error in the other direction may result in lower product yield, lower product concentration, or even lower production capacity than the plant design calls for. “ Actual broths can deviate significantly from each other as well as published correlations. Looking Forward Maybe someday there will be a universal kLa correlation which takes account all chemical and physical properties and is valid for all impeller types, covers all possible ranges of variables and includes all effects of scale. Until then, it is highly advisable to do the “wet” testing necessary to develop broth-specific correlations that lead to accurate design while minimizing total power costs. The present worth of electrical power costs can be $1,000 to $3,000 per kilowatt. Thus, the difference in power costs for a typical production fermenter can be hundreds of thousands of dollars depending on the correlation used. The exception of course, is for processes that produce such valuable products that massively oversizing equipment is a reasonable option. Nomenclature A Correlation constant; units depend on correlation units. a Gas-liquid interfacial area/volume, 1/M b correlation exponent (dimensionless) C Dissolved oxygen concentration, mass or moles/ volume (e.g., mg/l) Csat Dissolved oxygen concentration at saturation (mg/l) c Correlation exponent (dimensionless) DO Dissolved oxygen concentration, general term (mg/l) kLa Overall mass transfer coefficient, 1/time (1/s) kL Liquid film coefficient, M/s OTR Oxygen Transfer Rate, mass or moles per volumetime), e.g. mg/l-hr. P Agitator power, W P/V Specific Power: agitator invested power/(mass or volume) of liquid (e.g., W/l) Us Superficial Gas Velocity, distance/time (M/s) V Liquid volume, l VVM Volume of gas/volume of liquid/minute at standard conditions (min-1) Z Liquid level within tank, M References 1. Bakker, A., Smith, J. ,Myers, K.,“How to Disperse Gases in Liquids,” Chemical Engineering Magazine, 12, (1), pp. 98-114, 1994. 2. Benz, G., “Optimize Power Consumption in Aerobic Fermenters,” Chemical Engineering Progress, May 2003, pp. 100-103. 3. Benz, G., “Piloting Bioreactors for Agitation Scale-Up,” Chemical Engineering Progress, February 2008, pp.3234. 4. van’t Riet, K., Tramper, J., Basic Bioreactor Design, Marcel Dekker Inc., p.251, 1991. About the Author Gregory T. Benz is President of Benz Technology International, Inc. He received his BSChE from the University of Cincinnati in 1976, and has taken a course on fermentation biotechnology from the Center for Professional Advancement. A registered Professional Engineer in Ohio, he has more than 35 years of experience in the design of agitation systems. Currently, his company does general mixing consultation, including pilot plant protocol, equipment specification, and bid evaluation. Current activity includes several cellulosic ethanol, singlecell protein, and biomass projects. Benz also teaches courses on agitation with CEU/PDH credits. He is a member of AIChE, ISPE, SIM, and the American Chamber of Commerce in Shanghai. He is a Course Director for Aurora Analytics (www.aurora-analytics.com), currently teaching two courses on fluid agitation: one for bio/pharmaceutical, the other for biofuels. He is a registered expert with Intota (www.Intota. com). He can be contacted by telephone: +1-937-289-4504 or email: benztech@mindspring.com. Benz Technology International, Inc., 2305 Clarksville Road, Clarksville, Ohio 45113. PHARMACEUTICAL ENGINEERING January/February 2013 3


