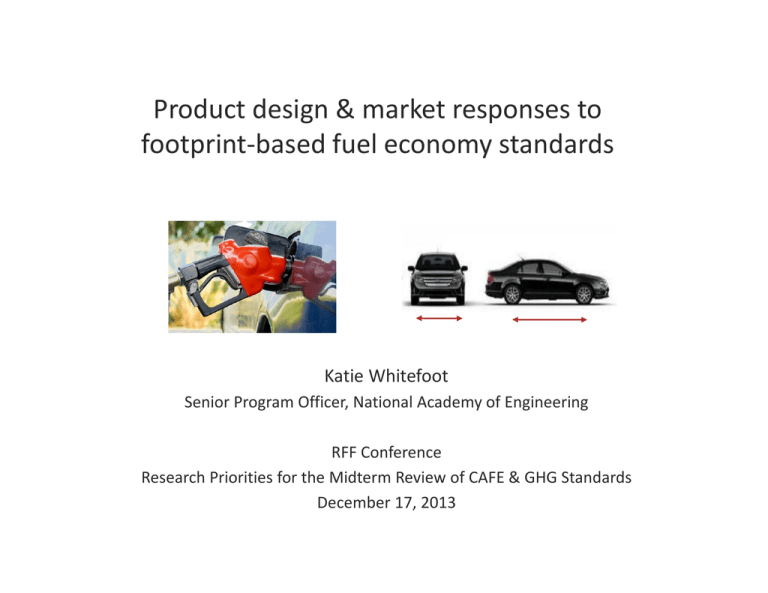
Product design & market responses to footprint-based fuel economy standards
advertisement
Quantifying the Impact of Environmental Policy on
Product
design
& market responses to
Engineering
Design
Decisions
footprint-based fuel economy standards
Katie Whitefoot
Senior Program Officer, National Academy of Engineering
RFF Conference
Research Priorities for the Midterm Review of CAFE & GHG Standards
December 17, 2013
Introduction
Click to edit Master titleEngineering
style
design model
Supply-side model
Demand-side model
Policy analysis
Summary and Recommendations
In the beginning…
2
Introduction
Click to edit Master titleEngineering
style
design model
Supply-side model
Demand-side model
Policy analysis
Summary and Recommendations
Integrate engineering design & IO economic models:
Engineering vehicle
design optimization
• Captures physics-based
tradeoffs between design
variables using engineering
simulations
• Construct engineering cost
estimates of design choices
Standard differentiatedproduct oligopoly model
• Captures consumer choices
based on product designs
and prices
• Captures competitive
behavior of firms in a
regulated market
• Econometrically estimate
other vehicle costs
3
Introduction
Click to edit Master titleEngineering
style
design model
Supply-side model
Demand-side model
Policy analysis
Summary and Recommendations
Consumers and competition are important to consider
Take-away points:
1. Vehicle designs, prices, consumer choices, and market share
are all endogenous to CAFE/GHG regulated market
2. Fuel economy/GHG outcomes depend on these responses
3. Consumer demand and equilibrium models should not
necessarily be used to determine standard stringency
4. This type of research should be used to inform rulemaking to understand sensitivities, and avoid undesirable
outcomes
4
Introduction
Click to edit Master titleEngineering
style
design model
Supply-side model
Demand-side model
Policy analysis
Summary and Recommendations
Not the first to “endogenize
“endogenize”
endogenize” product design choices!
Our work builds on recent work by Klier and Linn (2010) and Knittel
(2012) who econometrically estimate similar attribute trade-offs.
Why use simulated data in lieu of econometric approaches?
1. Many feasible design parameter combinations are not
observed in the data, but may be optimal under alternative
policy regimes.
2. Correlations between observed attributes (e.g. acceleration)
and unobservable attributes that affect fuel economy (such as
engine lubricants) can make it difficult to identify design tradeoffs econometrically.
5
Introduction
Click to edit Master titleEngineering
style
design model
Supply-side model
Demand-side model
Policy analysis
Summary and Recommendations
Engineering simulations capture vehicle design trade-offs
AVL Cruise 3.1
• “AVL Cruise” is a commercial
model used by the automotive
industry to inform powertrain
design
• We combine simulations,
NHTSA’s technology data, and
engineering cost estimates to
estimate tradeoffs
6
Introduction
Click to edit Master titleEngineering
style
design model
Supply-side model
Demand-side model
Policy analysis
Summary and Recommendations
Nest this design model within a familiar oligopoly framework
max
ܽܿܿ , ܿ݁ݐℎ ݆ ,݂ ݆ ݐ,∈ ݆∀ ݆ ℑ݂
s.t.
ߨ݂ = ݍ൫ ݆− ݆ܿ ൯
݆ ∈ℑ݂
ࢍ≤
݂ ݐ− 1.1݂݆ݐ0 ≤ 0
where
= ݆ݐݓℎ൫݂ ݆ݐ൯
Maximize profit with respect to vehicle footprint,
acceleration, level of technology, and price of each
vehicles firm f produces, j∈ℑf
Subject to CAFE standards
Increases in footprint restricted to 10% or less
Curbweight increases with vehicle footprint
݂݂݆݁ = ࣹ൫݆ܽܿܿ , ܿ݁ݐℎ݆ , ݐݓ൯
Fuel efficiency calculated from curbweight,
acceleration performance, and technology features,
based on engineering simulations
݆ܿ = ݓ൫݆ܽܿܿ , ܿ݁ݐℎ݆ , ݂ ݆ݐ൯ + ݆߱
Costs dependent on vehicle footprint,
acceleration performance, and technology features
Demand, dependent on all vehicles’ footprints,
= ݆ݍℊ൫{ ݇, ܽܿܿ݇ , ݂݂݁݇ , ݂} ݇ݐ: ݇ ∈ ℑ݂ ∀݂൯ prices, and acceleration
7
Introduction
Click to edit Master titleEngineering
style
design model
Supply-side model
Demand-side model
Policy analysis
Summary and Recommendations
Assume production costs increase at a ratio of 1:1
Assume fixed costs do not vary with footprint decisions
because all design changes occur during scheduled product
redesigns and subsystems are (re)designed after target
dimensions are set
Assume production costs increase 1% with a 1% increase in
footprint
We perform sensitivity tests on these assumptions
8
Introduction
Click to edit Master titleEngineering
style
design model
Supply-side model
Demand-side model
Policy analysis
Summary and Recommendations
Ranges of demand parameters used from literature
Estimating demand parameters requires addressing correlation of unobserved
attributes with vehicle footprint, fuel economy, acceleration performance, and price
Instead of solving endogeneity problem, examine potential for incentive
over range of plausible demand parameters from the literature
(e.g., Goldberg ‘98, Greene & Liu ‘87 Jacobsen ‘10, Helfand & Wolverton ‘11, Klier & Linn ‘08)
Price
Footprint (sq. ft)
Acceleration performance
(0.01 hp/lb)
Fuel efficiency (gal/100
mi)
Range of mean
elasticity
2.0–3.1
Range of estimated
willingness to pay
Coefficient range
$340–$2,000
0.7–1.0
Coefficient range with
price coefficient=1.0
2.12–12.71
$160–$5,500
0.06–2.07
$800–$9000
0.07–0.80
9
Introduction
Click to edit Master titleEngineering
style
design model
Supply-side model
Demand-side model
Policy analysis
Summary and Recommendations
We Make Many Simplifying Assumptions
Many possible technology options are not included
Demand model (simple logit) does not capture different
preferences across the population
Use a static equilibrium model to examine possible design
changes between 2006-2014
We include all vehicle model and engine options (~470 vehicles
total) but not more-detailed vehicle package options
10
Demand-side model
Policy analysis
Summary and Recommendations
Introduction
Click to edit Master titleEngineering
style
design model
Supply-side model
Incentive may be considerable depending on preferences
Sales-weighted average footprint increases in all cases except when
footprint preference is low and acceleration preference is high
In all other cases, average fuel economy is 1.4–3.9 mpg lower than if
vehicle sales and size remain unaffected, undermining fuel economy gains
by 20-53%
Preference for acceleration
Preference for fuel
efficiency
2014 CAFE Analysis
Preference for footprint
Low
High
Mid
Low
Mid
-1.4 sq. ft. +3.8 sq. ft.
High
+7.0 sq. ft.
+1.5 sq. ft.
+7.5 sq. ft.
+9.2 sq. ft.
+2.1 sq. ft.
+9.6 sq. ft.
+13.4 sq. ft.
11
Introduction
Click to edit Master titleEngineering
style
design model
Supply-side model
Demand-side model
Policy analysis
Summary and Recommendations
Incentive exists over large range of consumer preferences
Price
Preference for Preference for Preference for Sales-weighted average
Sensitivity fuel efficiency acceleration
vehicle size
change in size
High
Mid
High
Mid
+4.0 sq ft
Mid
Low
Mid
+9.4 sq ft
High
High
High
Mid
Mid
+5.9 sq ft
Low
Mid
Mid
+9.2 sq ft
High
Mid
Mid
Mid
+10.5 sq ft
Mid
Mid
Mid
Mid
+11.3 sq ft
Low
High
Low
High
Mid
+5.9 sq ft
High
High
Low
Mid
+9.3 sq ft
High
Mid
High
Low
-1.0 sq ft
High
High
Mid
Low
+1.3 sq ft
Mid
Mid
Low
+4.2 sq ft
Mid
Low
Low
High
+16.1 sq ft
Low
12
Introduction
Click to edit Master titleEngineering
style
design model
Supply-side model
Demand-side model
Policy analysis
Summary and Recommendations
Consumers and competition are important to consider
Summarizing Thoughts:
• We demonstrate that fleet mix and footprint decisions depend on regulations
& consumer preferences and that fuel economy/GHG outcomes depend
(potentially substantially) on these responses
Real world: MY2013 light truck and passenger car average footprints
trending to be larger than projected
• Flattening the standard (or creating consumer incentives for fuel efficiency) will
improve the chance of reaching CAFE/GHG goals
• Designing the standards such that no incentive exists is extremely difficult
considering:
• Average footprint depends on many factors, including engineering tradeoffs
between vehicle attributes, consumer preferences, production costs, and market
structure
• these factors may vary across vehicle models and are likely to change over time
13
Introduction
Click to edit Master titleEngineering
style
design model
Supply-side model
Demand-side model
Policy analysis
Summary and Recommendations
Need to understand, track and respond to footprint changes
Future research, data, and regulatory suggestions
• Consider demand & oligopolistic behavior affecting fleet mix in rulemaking
to guard against undesirable outcomes
• Track and report regularly on sales-weighted average footprint for
manufacturers and entire fleet
• Build in the flexibility to make necessary adjustments to the standards to
correct undesirable trends in the market’s response
• Learn more about the sensitivity of CAFE/GHG outcomes to consumer
preferences, regulation design, and technology options
• In particular: dynamics of product design schedules &
banking/borrowing credits, and changes in consumer preferences over
time
• Facilitate easy sharing of data & research between agencies and
researchers: detailed vehicle attributes, sales projections, models, etc.
14
