Examples for Chapter 9– Correlation and Regression Math 1040–1 Section 9.1
advertisement

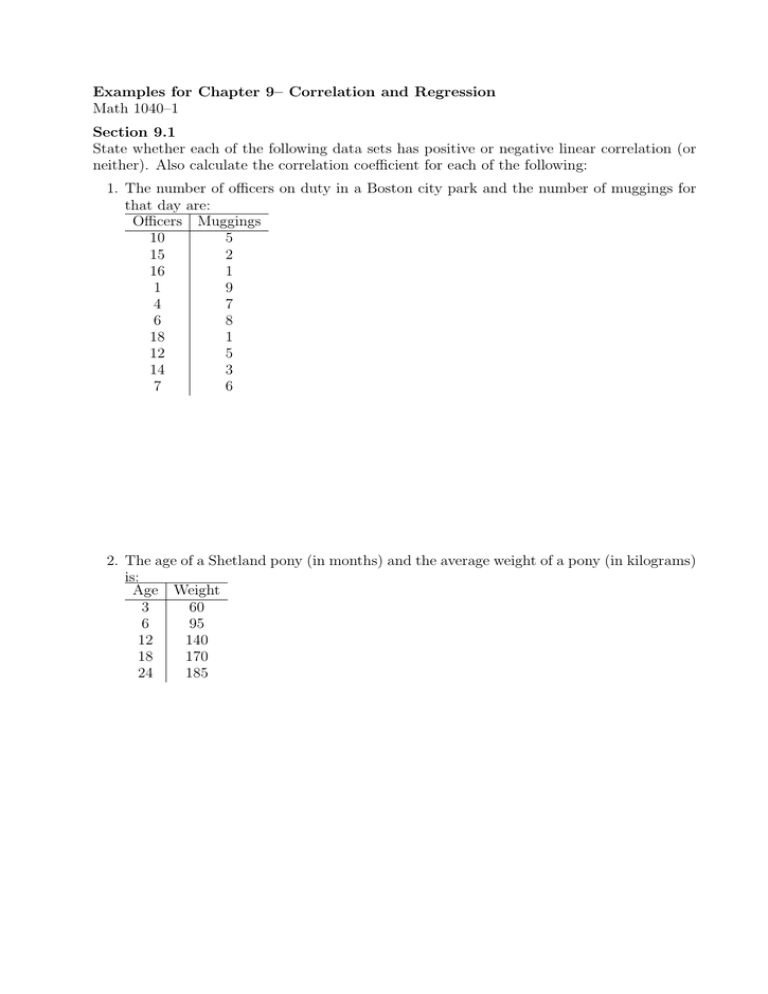
Examples for Chapter 9– Correlation and Regression Math 1040–1 Section 9.1 State whether each of the following data sets has positive or negative linear correlation (or neither). Also calculate the correlation coefficient for each of the following: 1. The number of officers on duty in a Boston city park and the number of muggings for that day are: Officers Muggings 10 5 2 15 16 1 9 1 4 7 8 6 18 1 12 5 14 3 7 6 2. The age of a Shetland pony (in months) and the average weight of a pony (in kilograms) is: Age Weight 3 60 6 95 12 140 18 170 24 185 3. The global average temperature (in degrees Celsius), and number of pirates are: Temperature Pirates 14.2 35000 14.4 45000 14.5 20000 14.8 15000 15.1 5000 15.5 400 15.8 17 Section 9.2 1. The number of officers on duty in a Boston city park and the number of muggings for that day are: Officers Muggings 10 5 15 2 16 1 1 9 4 7 6 8 18 1 12 5 14 3 7 6 Calculate the regression line for this data, and the residual for the first observation, (10, 5). What percentage of variation is explained by the regression line? 2. A study involved comparing the per capita income (in thousands of dollars) to the number of medical doctors per 10,000 residents. Six small cities in Oregon had the observations: Per capita income Doctors 8.6 9.6 18.5 9.3 10.1 20.9 10.2 8.0 8.3 11.4 13.1 8.7 The data has a correlation coefficient of r = 0.934. Calculate the regression line for this data. What percentage of variation is explained by the regression line? Predict the number of doctors per 10,000 residents in a town with a per capita income of $8500.


