Synthetic seismograms through synthetic Franciscan: Insights into factors affecting large-aperture seismic data
advertisement

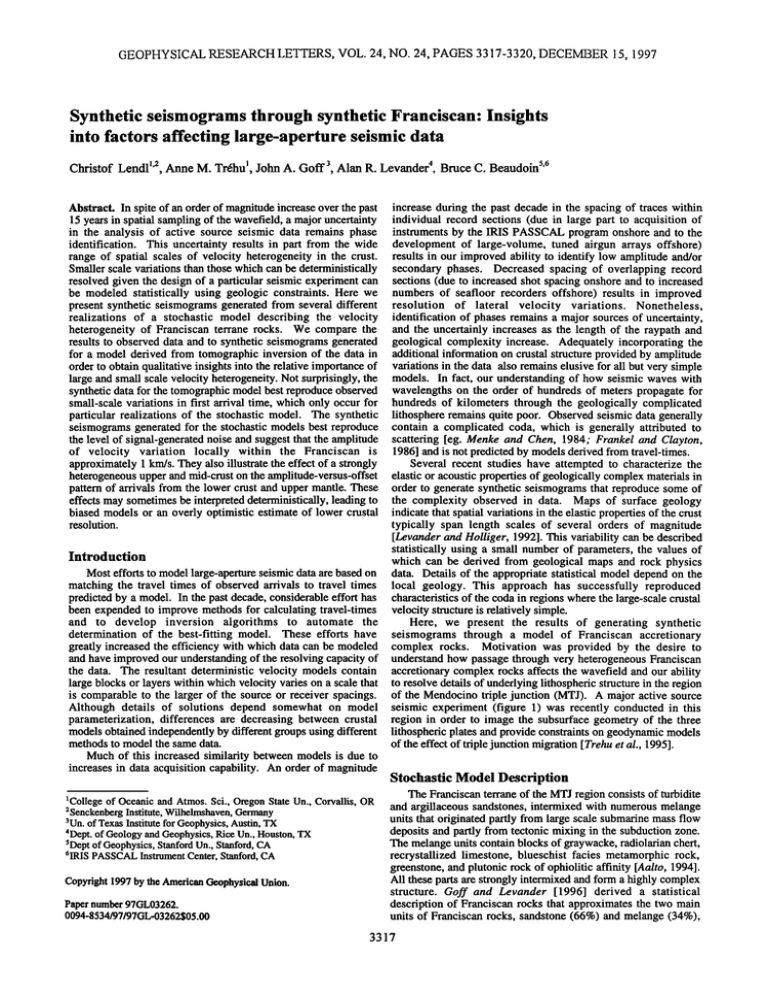
GEOPHYSICALRESEARCHLETTERS, VOL. 24, NO. 24, PAGES 3317-3320,DECEMBER 15, 1997 Syntheticseismogramsthrough syntheticFranciscan:Insights into factors affecting large-aperture seismicdata ChristofLendl•'2AnneM. Trthu• JohnA. Goff3 AlanR. Levander n,BruceC. Beaudoin 5'6 increaseduring the past decadein the spacingof traceswithin individual record sections(due in large part to acquisitionof instrumentsby the IRIS PASSCAL programonshoreand to the developmentof large-volume,tuned airgun arrays offshore) resultsin our improvedability to identifylow amplitudeand/or Abstract. In spiteof an orderof magnitudeincreaseoverthepast 15 yearsin spatialsamplingof the wavefield,a majoruncertainty in the analysis of active source seismic data remains phase identification. This uncertaintyresultsin part from the wide range of spatial scalesof velocity heterogeneityin the crust. Smaller scalevariationsthan thosewhich can be deterministically resolvedgiven the designof a particularseismicexperimentcan be modeled statistically using geologic constraints.Here we presentsyntheticseismograms generatedfrom severaldifferent realizations of a stochastic model describing the velocity heterogeneityof Franciscanterranerocks. We comparethe resultsto observeddata and to syntheticseismogramsgenerated for a model derived from tomographicinversionof the data in orderto obtainqualitativeinsightsinto therelativeimportance of largeandsmallscalevelocityheterogeneity. Not surprisingly, the secondaryphases. Decreasedspacingof overlappingrecord sections(due to increasedshotspacingonshoreand to increased numbersof seafloorrecordersoffshore)resultsin improved resolution of lateral velocity variations. Nonetheless, identification of phasesremainsa majorsources of uncertainty, and the uncertainlyincreasesas the lengthof the raypathand geologicalcomplexityincrease. Adequatelyincorporating the additionalinformationon crustalstructure providedby amplitude variations in thedata alsoremainselusivefor all butverysimple models. In fact, our understandingof how seismicwaves with synthetic datafor thetom0graphic modelbestreproduce observed wavelengthson the order of hundredsof meterspropagatefor small-scalevariationsin first arrival time, which only occurfor hundredsof kilometersthroughthe geologicallycomplicated particularrealizationsof the stochasticmodel. The synthetic lithosphere remainsquitepoor. Observedseismicdatagenerally seismograms generatedfor the stochastic modelsbestreproduce contain a complicatedcoda, which is generally attributedto the level of signal-generated noiseandsuggestthatthe amplitude scattering[eg. Menke and Chen, 1984; Frankel and Clayton, of velocity variation locally within the Franciscan is 1986] andis notpredictedby modelsderivedfrom travel-times. approximately1 krn/s.They alsoillustratetheeffectof a strongly Several recent studieshave attemptedto characterizethe heterogeneous upperandmid-cruston theamplitude-versus-offsetelasticor acousticpropertiesof geologicallycomplexmaterialsin patternof arrivalsfrom the lower crustand uppermantle.These orderto generatesyntheticseismograms that reproducesomeof effectsmay sometimes be interpreted deterministically, leadingto the complexityobservedin data. Maps of surfacegeology biasedmodelsor an overly optimisticestimateof lower crustal indicatethatspatialvariationsin theelasticproperties of thecrust resolution. typically span length scalesof several orders of magnitude [Levanderand Holliger, 1992]. This variabilitycanbe described statisticallyusing a small number of parameters,the valuesof Introduction which can be derivedfrom geologicalmapsand rock physics Most effortsto modellarge-apertureseismicdataare basedon data. Details of the appropriatestatisticalmodeldependon the matchingthe travel times of observedarrivals to travel times local geology. This approachhas successfullyreproduced predictedby a model. In the pastdecade,considerable effort has characteristics of the codain regionswherethelarge-scale crustal beenexpendedto improvemethodsfor calculatingtravel-times velocitystructureis relativelysimple. and to develop inversion algorithms to automate the Here, we present the results of generating synthetic determination of the best-fitting model. These efforts have seismogramsthrough a model of Franciscan accretionary greatlyincreasedthe efficiency with which data can be modeled complex rocks. Motivation was provided by the desire to andhaveimprovedourunderstanding of theresolvingcapacityof understand how passagethroughvery heterogeneous Franciscan the data. The resultant deterministicvelocity models contain accretionary complexrocksaffectsthe wavefieldandour ability large blocksor layerswithin which velocityvarieson a scalethat to resolvedetailsof underlyinglithospheric structure in theregion is comparableto the larger of the sourceor receiver spacings. of the Mendocinotriplejunction(MTJ). A majoractivesource Although details of solutions depend somewhat on model seismicexperiment(figure 1) was recently conductedin this parameterization,differences are decreasingbetween crustal region in order to image the subsurfacegeometryof the three modelsobtainedindependently by differentgroupsusingdifferent lithospheric platesandprovideconstraints on geodynamic models methods to model the same data. of the effectof triplejunctionmigration[Trehuet al., 1995]. Much of this increasedsimilarity between models is due to increasesin data acquisitioncapability. An order of magnitude •Collegeof OceanicandAtmos.Sci.,OregonStateUn., Corvallis,OR 2Senckenberg Institute, Wilhelmshaven, Germany 3Un.of TexasInstitute forGeophysics, Austin, TX 4Dept.of Geology andGeophysics, RiceUn.,Houston, TX 5Deptof Geophysics, Stanford Un.,Stanford, CA 6IRIS PASSCALInstrument Center,Stanford,CA Copyright 1997bytheAmerican Geophysical Union. Papernumber97GL03262. 0094-8534/97/97GL-03262505.00 StochasticModel Description The Franciscanterraneof the MTJ regionconsistsof turbidite and argillaceoussandstones, intermixedwith numerousmelange unitsthat originatedpartly from large scalesubmarinemassflow depositsand partly from tectonicmixing in the subductionzone. The melangeunitscontainblocksof graywacke,radiolarianchert, recrystallized limestone, blueschistfacies metamorphicrock, greenstone, andplutonicrock of ophioliticaffinity [Aalto, 1994]. All thesepartsare stronglyintermixedandform a highlycomplex structure. Goff and Levander [1996] derived a statistical descriptionof Franciscanrocksthat approximatesthe two main units of Franciscanrocks, sandstone(66%) and melange(34%), 3317 3318 LENDL ET AL.: SYNTHETIC SEISMOGRAMS THROUGH SYNTHETIC FRANCISCAN 125ø 42 ø 4V 39øN 124ø 123ø refracted through the Franciscan rocks. Allowing for twodimensionalvelocity variationin a tomographicinversionof first arrivalsleadsto a structurecontaininglarge "blobs"of higheror lowervelocityin theupper10 km [Beaudoinet al., 1996]. Three differentrealizationsof the stochasticP-wave velocity model are shown in figure 2a, as are the simple and ::::::::::::::::::::::::::::::::::::::::::::::::::::::::::::::::::::::::::::::::::::::::::::: •11 \\%// %11•11 \\%//, •\11•11 \\% tomographically-derived deterministic models. For each i•:..:i•-::.!•!:!!!!:!!!::i:::i:!•::•::•.!::•:•:•:•:•:•::•:•::•:•::• • •1, ,,• II •• II• •x ........... '•Z?•..•.•.• ......... •::.:' .•_It •' II• ,,,,• II • stochasticmodel, the peak-to-peak velocity difference in the :::::::::::::::::::::::::::::::::::::::::::::::::::::::::::::::::::::::::::::::::::::::::::::::::::::: - •'• ////• • * ' ////• • *. ' ////•a:'•Z// stochasticgrid is 1.0 km/s. For the lowermostcrustand upper mantle, a model representingthe crust of the subductedGorda plate, which dipsto the southand endsnearkm 80, wasincluded in all models based on preliminary analysis of wide-angle reflections; south of km 80, a lower crust representinga ::::::::::::::::::::::::::::::::::::::::::::::::::::::::::::::::::::::::::::: • -•.'? tectonically or magmatically underplated mafic layer was :::::...•g•:::•:•:?•:•::[:::•::::?:: .•g:.•... included. This particularlower crustalmodel is not meant to representa "final" model for line 9; it is includedto illustratethe effect of the overlying stochasticallyheterogenouscrust on :::::::::::::::::::::::::::::::::::::::::::::::::::::::::::::::::•::•]•::::::[::•:::•:•[•:::•[•: - . .:: e•'..g:•' • signals from underlying structures. Although a general thickeningof the crust in the central portion of line 9 is well :::::::::::::::::::::::: •::: ::•::::••f•f• •[::•4•?:•:•?:[::?::•:?:[:[•?:•::::•?:•:•:?:: : •:- -e'.½ • ':•- .•:..-e'. determinedfrom the data, detailsof the lower crust and upper ::::::::::::::::::::::::::::::::::::::::::::::::::::::::::::::::::::::::::::::::::::::::::::::::::::::::::::::::::: ' • • ... mantlein thisregionare the subjectof ongoinginvestigation. Calculation of Synthetic Seismograms Syntheticseismogramswere calculatedusing an isotropic, elastic,2-dimensional,staggered-grid, finite-differencealgorithm to solve the wave equation. Three-dimensionalversionsof this Figure 1. Simplifiedgeologicmapof noahwestern C•ifornia algorithmhave been discussedby Rodriguesand Mora [1992] showingthe locationof the seismicprofilethat inspiredthis and Igel et aL [1995]. The algorithm,which calculateseighthmodelingeffoa. Shotpoints areshownastfi•gles; theshotpoint orderspatialderivativesusingthe methodof Holberg[1987] and modeledin thispaper(911)is labeled.SAF - San•dreas fault, forth-ordertemporalderivativesthroughTaylor seriestruncation, MAF - Maacama fault, BSF - Bartlett Springs fault, CSZ - has been implemented on a ConnectionsMachine CM-5 at Oregon State University to permit calculation of synthetic Cascadiasubductionzone, MFZ - Mendocino fracturezone. seismograms and visualizationof wavefieldpropagation through complicated 2-dimensional models derived from travel-time analysis of data from large-aperture active-source seismic asa bimodal,approximately fractal,sinuously connected velocity experiments[Lendl, 1996].. distribution, with model parametersderived from digitized In figure2b, theobserved datafroma 2270kg explosiveshot geological maps.The Franciscan is particularly interesting in that [Godfrey et al., 1995] locatedat the northernend of line 9 are it is characterized by two distinctlengthscalesandtransverse comparedto syntheticseismogramsfor sevendifferent models: anistropy.Characteristic verticallengthscalesareapproximately thesimpledeterministic model,thetomographic model,modelR1 1.3 and 5.5 km, with horizontalscalelargerby a factorof 2.75. for peak-to-peak stochastic velocityvariationsof 0.5, 1.0 and 1.5 We present synthetic seismograms for several different km/s, and modelsR2 and R3 for a peak-to-peakstochastic realizationsof this velocitymodelandcomparethemto synthetic velocityvariation1 km/s. ModelsR1, R2 and R3 represent different realizations of the same stochastic model. All seismograms for deterministicvelocitymodels. Each realizationof the stochasticmodelis represented by a seismograms are displayedwith a reductionvelocityof 6.5 km/s binarygrid in which valuesof + 1 representsandstone and values and preserverelative amplitudevariationsas a functionof both of-1 identify melange units. This is admittedly a gross time and offset. simplificationof velocity structureof the Franciscanterrane,as For the calculations, the densityandelasticproperties of the the melangeis itself a very complex,heterogeneous medium. A material, derivedfromP andS wavevelocities, mustbespecified. grid spacingof 100 m was chosento permit calculationof P-velocitygridswerecreatedasdiscussed above.S-velocityand seismic waves with a frequencycontent of up to 5 Hz for densitygridswerederivedfromtheP-velocitygridsassuming a velocitiesgreaterthan 3 km/s. The valuesin the grid werethen Poisson'sratio of 0.25 and a fifth order polynomialfit to a scaledto producea specifiedmaximumvelocity differencethat compilationof laboratoryvelocity/densitymeasurements [Zelt rangedfrom 0.5 to 1.5 km/s for differentmodels.After scaling, andSmith,1992]. Resultsarenot very sensitive to uncertainties the averagevelocity of the stochasticvariationswas removed in S-wavevelocityor density[Lendl,1996]. from the grid to producea meanvalue of 0, and the grid was Stability andconvergence of finitedifference calculations masked to outline a region of Franciscanrocks in the model. depend on theproperchoiceof timestepAt andgridspacing Ax, BeneaththeFranciscan, thevalueof the stochastic gridwas0. which dependin turn on the lowestvelocityin the model,the The stochasticvelocity grid was then addedto a simple highestfrequencyin the source,and the algorithmsusedfor deterministicvelocitygrid determinedfrom travel-timeanalysis spatial and temporal differentiation [Levander, 1989]. of the data from line 9 of the Mendocinotriplejunctionseismic Theoreticalconsiderations [Rodrigues andMora, 1992;Igel et experiment. Line 9 is located entirely within the Franciscan al., 1995;Lendl, 1996]indicatethata grid spacing of at least3 Coast Rangesof northwesternCalifornia (figure 1). For this grid points/wavelength and (cp At)/(Ax) = 1ß205, wherec is the study,the velocitywithintheFranciscan rockswasrepresented by a velocity of 3.0-4.0 km/s at the surfaceand of 6.5 km/s at the the algorithmusedhere. A seriesof simulationswasdoneto test baseof the Franciscan.This simplevelocitystructurerepresents the domainof validity and determinean acceptablelevel of the one-dimensionalvelocitymodel that providesthe bestfit to dispersion.The final choicewas a grid spacingof 100 m and the observed first arrivals interpreted to representP-waves time stepsof 0.01 s. The maximumfrequencyin the seismic largest P-wave velocity inthe model, are adequate forsta•ility of LENDL ET AL.: SYNTHETIC S DISTANCE ALONG MODEL (km)N 0 50 100 150 200 250 0 I-- SEISMOGRAMS THROUGH SYNTHETIC S N shot 911- data /•' .•'1"h•.•_•_;: ....; '[t,•',"•;'; -' t.• •.' ..•-'•,T'i FRANCISCAN S 3319 N 10 tomography 10 lower crust LIJ '------ ugper zrtle C340 ,•mple rncclel o 250 E 125 to•m 25O o sim.lemodel 1- 20 10 125 R1 - 0.5 krn/s 10 r 0 3:20 0 ,, 25O .hat • rand I R I 125 0 R2- 1.0krn/s 125 250 10 0 R1 - 1 0 krn/s 10 0 c3 40 'h •O. IRZ 0 25O 125 0 125 250 0 0 o R1 - 1 5 km/s 10 1- 20 l•.,ha ,,n elF'3 P-WAVEVELOCITY (knVs) 0 250 125 OFFSET (km) Figure2 a. Velocitymodels. 0 ! 250 125 0 OFFSET (km) Figure2b.SynthelJc seismograms forthemodels of figure2a compared todataforshot911. Figure 2a. Velocitymodels.Positions of shotpoints alongtheseismicprofilearealsoshown.Fromtopto bottom,themodels are:thesimpledeterministic model;thetomographic inversion of firstarrivaltimes[Beaudoin et al., 1996],modifiedto include the samelower crustas in the other models;three differentrealizationsof the stochasticmodel, generatedby using different randomnumberseeds(seetext). The amplitudeof velocityvariationfor the stochastic modelsis 1 km/s. Figure 2b. Observeddatafor shotpoint911 comparedto syntheticseismograms for the modelsshownin figure 2b and for differentamplitudes of stochastic velocityvariation.Severalimportant phases havebeenlabeledonthesynthetics for thesimple deterministic model: Pg- crustal diving wave; Pn- upper mantle interface head wave; PiP- reflection fromthetopofthelower crustlayer;PmP- reflectionfromthebaseof thelowercrustallayer. Seetext for furtherexplanation. source, whichis defined bya Gaussian function, is 5 Hz. The noise mustbesignal-generated. Alsocharacteristic arethelarge synthetic seismograms forthesimple deterministic model (figurevariations intheamplitude ofthesignal, withstrong secondary 2b)givea qualitative ideaofthelevelofnumerical noise with arrivals observed locally thatcannot bereadily identified. These these parameters. Whilethedatacontain higher frequencies, features arenotobserved in thesynthetic seismograms forthe calculating synthetic datawithsuch highfrequencies formodelssimple deterministic model. Whilethesynthetic seismograms for thesizerequired isbeyond ourcurrent computing capabilities. themodel derived deterministically viatomographic inversion of Absorbing boundary conditions areimplemented onthesides the first arrivalsaccurately reproduce the variableapparent andbottomof themodelby extending themodelandmultiplyingvelocityof the first arrivals,the focussing anddefocussing of displacement amplitudes withinthisregionby an absorbtion energy in thePg arrivalandin thefollowing oneortwoseconds factorthatdecreases exponentially withinthisboundary region is exaggerated. Thismodelalsodoesnotreproduce theobserved [Cerjanet al., 1985].Forthesynthetics shown here,thetopof levelofbackground signal-generated noise. the model acts as free surface. Because the near-surface Comparing the seismogramsfor the simple deterministic velocitiesin the model are considerablyhigher than velocities model to thosefor stochasticmodel R1 with different peak-tomeasurednear the surface along line 9 (again becauseof peakstochastic velocityvariations,we seethat,not surprisingly, computational limitations), andbecause intrinsicattenuation is the seismograms for the stochastic modelsshowconsiderable not included,strongsurfacewavesappearin the synthetics that energyfollowingthefirstarrivals.For velocityvariations of 0.5 arenot apparentin thedata. km/s, the background scattering level is distributed homogeneously along the whole profile. With increasing Discussion stochastic velocitycontrast, strongfrequency-dependent One featureof the data (figure 2b), whichis generally attenuation is observed withincreasing offset. Othereffectsof characteristicof data collectedwithin the Franciscanterrane,is the increasedscatteringare that weakerarrivalsdisappearinto the the strong"background" noisefollowingthefirst arrivals. This "background" signal-generated noiseandthatthedetailsof travel- 3320 LENDLETAL.: SYNTHETIC SEISMOGRAMS THROUGH SYNTHETIC FRANCISCAN time triplications are obscured. The model with a 1.0 km/s modeling algorithm, andtoMarkAbbott andtheNASAEarth Observing stochastic velocity variation produces synthetic seismograms that, System program forproviding theCM-5supercomputer thatmadethe qualitatively, mostresemble theobservations. However, because calculations possible. TomBrocher andananonymous reviewer provided the sourcefor the syntheticseismograms doesnot contain helpfulcomments. Figures wereconstructed usingGMT [Wessel and frequencies above5 Hz whereastherealsourcedoesandbecause Smith,1995].Thisproject wasfunded by theContinental Dynamics scattering in themodelistwo-dimensional whereas scattering in programof the NationalScienceFoundation through grantsEAR- the earthis three-dimensional, quantitative estimations of the 9219870 and EAR-9527001. amplitudeof velocityvariationand attenuation in the Franciscan terranefromthesesimulations arenotjustified. References We alsocompared synthetic seismograms forseveral different Aalto,K. R., LateCenozoic sediment provenance andtectonic evolution realizationsof the samestochastic model(i.e. modelsderived of thenorthernmost CoastRanges, California, Penrose Conference, using the same backgrounddeterministicmodel and the same Eureka, CA, Guidebook Penrose FieMTrip,73-89,1994. statisticalparameters to definevelocityvariationwithin the Beaudoin, B.C.,N.J.Godfrey, S.L. Klemperer, C.Lendl, A.M. Trthu, Franciscan terrane). Theseismic sections generated in thisway T.J.Henstock, A.R.Levander, J.E.Holl,A.S.Meltzer, J.H.Luetgert, Resultsfrom showsimilarities anddifferences. Forexample, thecharacter of andW. D. Mooney,Thetransitionfromslabto slabless: TripleJunction seismic experiment, Geology, 24, thecrustal divingwave(Pg)is differentfor thedifferent the1993Mendocino 195-199, 1996. realizations. Theseismic sections forR1andR2show thePg C., D. Kosloff, R. Kosloff andM. Reshef, A non-reflecting arrivalcontinuing smoothlywith an approximately constant Cerjan, boundary condition fordiscrete acoustic andelastic waveequations, apparent velocity fromoffsets of 25-110 km,where Pg is Geophysics,50,705-708, 1985. overtakenby the Pn arrival. Amplitude modulationand Frankel,A., andR. W. Clayton,Finitedifference simulations of seismic secondary arrivals thatclosely follow Pgaresomewhat different scattering: implications for thepropagation of short-period seismic forthese tworealizations. Incontrast, thePgarrival forR3shows waves inthecrust andmodels ofcrustal heterogeneity, J.Geophys. Res., largervariations of apparent velocityandgreateramplitude 91, 6465-6489, 1986. modulation, similarto the observations andto the syntheticGodfrey, J.J.,B.C.Beaudoin, C.Lendl, A.Meltzer, andJ.Luetgert, Data seismograms generated forthetomographic inversion model. reportfor the 1993Mendocino triplejunction seismic experiment, Report 95-275, U.S.Geological Survey, 83pp.,1995. The apparent amplitudeversusoffset(AVO) behaviorof the Open-File Incorporating "sinuous connectivity" into wide-angle reflectionfromthebaseof thecrust(PmP)alsois Goff,J.A.,andA.R.Levander, stochastic models ofcrustal heterogeneity: Examples fromtheLewisian differentfor the threerealizations.For R1 andR3, PmPis gneiss complex, Scotland, theFranciscian formation, California, andthe observed foroffsets of 60-210km,butthecharacter ofthisphase Hafafitgneiss complex, Egypt.,J. Geophys. Res.,101,8489-8502, is different. R1 showstwo large"shingles" at 140-160km 1996. offsets, whereas R3 shows smaller"shingles" atoffsets of 75-120 Holberg, O., Computational aspects of thechoiceof operator and km. R2 doesnotshow"shingles" andPmPis delayed beyond sampling interval fornumerical differentiation in large-scale simulation Geophys. Prospecting, 35,629-655,1987. offsets of about160km. In addition, a strong phase precedes ofwavephenomena, propagation through finitePmPat offsetsof 80-110km onR2 (andin thedata),butis not Igel,H., P. Mora,B. Riollet,Anisotropic difference grids,Geophysics, 60, 1203-1216, 1995. visible on R1 and R3. wavefield modeling of large-aperture data The differencesamong the syntheticseismicsections Lendl,C., Finitedifference triplejunction seismic experiment, M.S. generatedfor three different realizationsof the samestochastic fromthe 1993Mendocino thesis,163pp.,OregonStateUn., 1996. model obviouslydependon the spatialdistributionof the Levander, A. R.,Finite-difference forward modeling in seismology, in stochastic velocity variations. In areas of dominantly large-scale TheEncyclopedia ofSolid EarthGeophysics, edited byD. James, pp. 1989. velocityvariations, thewavefronts arebroken intoseparately 410-431,Van-Nostrand-Reinhold, distinguishable wavefronts, andstrongtraveltime variations and Levander, A. R.,andK. Holliger, Small scale heterogeneity andlargeamplitude modulation result.Areasof dominantly small-scale scale velocity structure of thecontinental crust, J. Geophys. Res.,97, variations,on the otherhand,scatterthe wavefrontandcreatean 8797-8804, 1992. envelope ofenergy. Wavefronts forR3travelalmost exclusivelyMenke,W., andR. Chen,Numericalstudiesof thecodafall-offrateof wavesin randomly layeredmedia,Bull.Seis.Soc. throughareaswith large-scale velocityvariations,whereas multiply-scattered Am., 74, 1079-1081, 1984. wavefronts for R1, travelprimarilythrough a regionof small- Pullammanappallil, S.,A. Levander, andS. P.Larkin,Determination of scalevariationsfor the raypathsof phasesdiscussed above.It crustal stochastic parameters fromseismic exploration data, J.Geophys. should benotedthatthesamevariations wouldbegenerated for Res.,102, 15269-15286,1997. differentshotpoint locations anda singlemodelrealization,Rodrigues,D., andP. Mora,Analysisof a finitedifferencesolutionto the perhaps explaining observed AVOdifferences fora givenphase three-dimensional elasticwaveequation, 62ndAnn.Int. Mtg., Soc. from differentshotpoints in activesourceseismicdata. Such Expl. Geophys.,ExpandedAbstracts,124%1249, 1992. WorkingGroup,Pullingtherugoutfrom variations aresometimes interpreted asthesignature of lower Tr6hu,A.M., andMendocino crustand uppermantlestructurewhereastheseresultsshowthat theymaybe produced by amplitude variations withintheupper and mid-crust. underCalifornia:Seismicimagesof the Mendocino TripleJunction region,Eos TransAGU, 76 (38), 369, 1995. Wessel,P., andW. H. F. Smith,New versionof thegeneric mapping toolsreleased,EosTransAGU, 76 (33), 329, 1995. Weconclude thatthesuccess ofthi•initial effort atsimulating Zelt, C. A., and R. B. Smith, Seismictraveltime inversionfor 2-D crustal wave propogationfor distancesof 100s of km through complicated crustalmodelssuggests thatfutureeffortsto extract velocitystructure,Geophys. J. Int., 108, 16-34,1992. information onsmall-scale crustalheterogeneity directlyfromthe data [Pullammanappallilet al., 1997] shouldbe fruitful. This C. Lendl, Senckenberg Institute, Schleusenstr. 39A, D-26382, informationcan then be usedto compensate for small-scale Wilhelmshaven,Gemany. author),Collegeof OceanicandAtmospheric effectswhenmodelingtravelingtimesto derivelarge-scale A.M. Trthu (corresponding Sciences, OregonStateUniversity,104OceanAdminBldg.,Corvallis, lithosphericstructure. Acknowledgements. Many thanksto thosewho made the Mendocino triplejunctionseismic experiment possible, including the OR 97331-5503 (e-mail: trehu@oce.orst.edu). J. A. Goff, Un. of TexasInstitutefor Geophysics, Austin,TX. A. R. Levander,Dept.of GeologyandGeophysics, RiceUn., Houston,TX. B.C. Beaudoin,IRIS PASSCALInstrumentCenter,Stanford,CA. many instrumentdeployersand the IRIS/PASSCAL,USGS, and Lithoprobeinstrumentcenters,whichfurnishedinstruments for the data (Received March18,1997;revisedOctober 3, 1997; acquisition. Thanks alsoto PeterMoraforproviding thefinitedifference acceptedOctober29, 1997 ).


