Document 11343803
advertisement

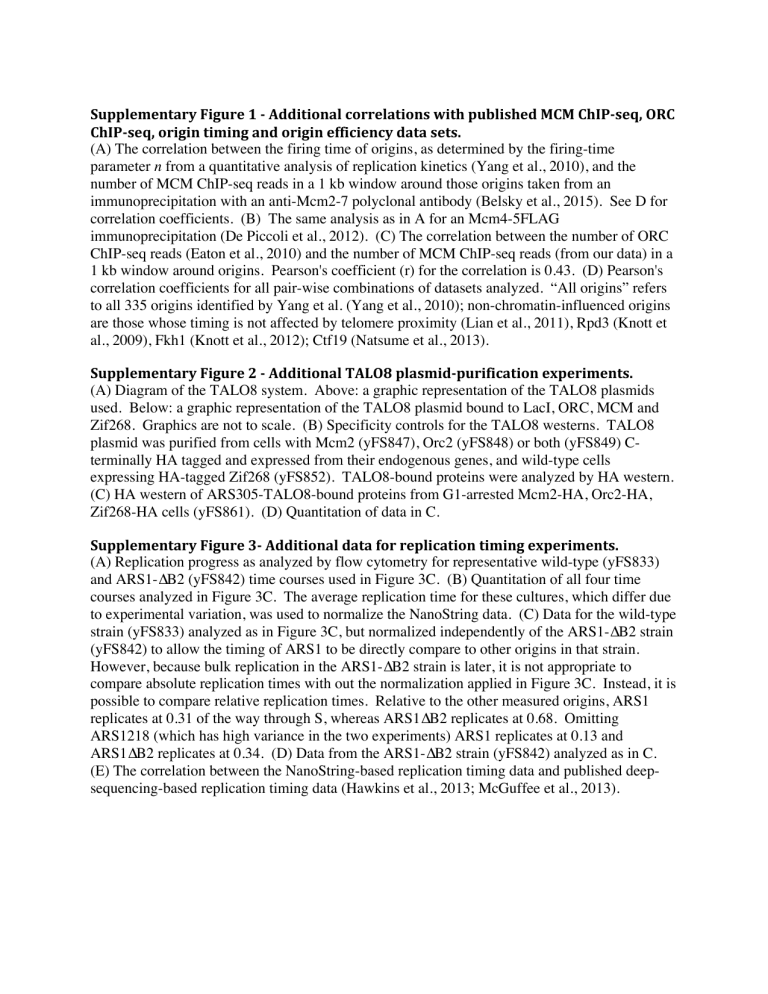
Supplementary Figure 1 -­ Additional correlations with published MCM ChIP-­seq, ORC ChIP-­seq, origin timing and origin efficiency data sets. (A) The correlation between the firing time of origins, as determined by the firing-time parameter n from a quantitative analysis of replication kinetics (Yang et al., 2010), and the number of MCM ChIP-seq reads in a 1 kb window around those origins taken from an immunoprecipitation with an anti-Mcm2-7 polyclonal antibody (Belsky et al., 2015). See D for correlation coefficients. (B) The same analysis as in A for an Mcm4-5FLAG immunoprecipitation (De Piccoli et al., 2012). (C) The correlation between the number of ORC ChIP-seq reads (Eaton et al., 2010) and the number of MCM ChIP-seq reads (from our data) in a 1 kb window around origins. Pearson's coefficient (r) for the correlation is 0.43. (D) Pearson's correlation coefficients for all pair-wise combinations of datasets analyzed. “All origins” refers to all 335 origins identified by Yang et al. (Yang et al., 2010); non-chromatin-influenced origins are those whose timing is not affected by telomere proximity (Lian et al., 2011), Rpd3 (Knott et al., 2009), Fkh1 (Knott et al., 2012); Ctf19 (Natsume et al., 2013). Supplementary Figure 2 -­ Additional TALO8 plasmid-­purification experiments. (A) Diagram of the TALO8 system. Above: a graphic representation of the TALO8 plasmids used. Below: a graphic representation of the TALO8 plasmid bound to LacI, ORC, MCM and Zif268. Graphics are not to scale. (B) Specificity controls for the TALO8 westerns. TALO8 plasmid was purified from cells with Mcm2 (yFS847), Orc2 (yFS848) or both (yFS849) Cterminally HA tagged and expressed from their endogenous genes, and wild-type cells expressing HA-tagged Zif268 (yFS852). TALO8-bound proteins were analyzed by HA western. (C) HA western of ARS305-TALO8-bound proteins from G1-arrested Mcm2-HA, Orc2-HA, Zif268-HA cells (yFS861). (D) Quantitation of data in C. Supplementary Figure 3-­ Additional data for replication timing experiments. (A) Replication progress as analyzed by flow cytometry for representative wild-type (yFS833) and ARS1-∆B2 (yFS842) time courses used in Figure 3C. (B) Quantitation of all four time courses analyzed in Figure 3C. The average replication time for these cultures, which differ due to experimental variation, was used to normalize the NanoString data. (C) Data for the wild-type strain (yFS833) analyzed as in Figure 3C, but normalized independently of the ARS1-∆B2 strain (yFS842) to allow the timing of ARS1 to be directly compare to other origins in that strain. However, because bulk replication in the ARS1-∆B2 strain is later, it is not appropriate to compare absolute replication times with out the normalization applied in Figure 3C. Instead, it is possible to compare relative replication times. Relative to the other measured origins, ARS1 replicates at 0.31 of the way through S, whereas ARS1∆B2 replicates at 0.68. Omitting ARS1218 (which has high variance in the two experiments) ARS1 replicates at 0.13 and ARS1∆B2 replicates at 0.34. (D) Data from the ARS1-∆B2 strain (yFS842) analyzed as in C. (E) The correlation between the NanoString-based replication timing data and published deepsequencing-based replication timing data (Hawkins et al., 2013; McGuffee et al., 2013). Figure S1 A MCM counts - Belsky 4000 3000 2000 1000 B MCM counts - De Piccioli 0 0 8000 60 80 20 40 60 80 4000 2000 0 10000 Integrated ORC signal 40 6000 0 C 20 Origin Timing/Efficiency (n) Origin Timing/Efficiency (n) 8000 6000 4000 2000 0 D 0 20 40 Timing/Efficiency Data Yang McGuffee Hawkins 60 80 100 Integrated MCM signal 120 Origins Analyzed All Non-chromatin-influenced All Non-chromatin-influenced All Non-chromatin-influenced Das 0.42 0.54 0.47 0.50 0.46 0.47 Belsky 0.54 0.61 0.49 0.54 0.46 0.48 De Piccioli 0.44 0.58 0.43 0.46 0.42 0.44 ZIF La La c I La cI La cI cI O Mcm2-HA L O ac R C M MC M MC Orc2-HA Zif268 Z IF MCM MCM 8x MCM MCM Zif268-HA B Mcm2-HA O ac L Orc2-HA 8x A Mcm2-HA Orc2-HA Figure S2 Zif268-HA Mcm2-HA Orc2-HA Zif268-HA D 5 Signal relative to Zif268 C ARS305 4 3 2 1 0 4.65 MCM 0.77 ORC Figure S3 A B minutes after release 80 70 60 55 50 45 40 35 30 25 20 10 3hr alpha factor asynchronous ARS1 G1 ARS1-∆B2 E trep from NanoString 55 50 45 40 35 30 ARS316 ARS603 ARS601 ARS501(aka ARS522) ARS1226 ARS415 ARS1 (aka ARS416) ARS1218 r2 = 0.83 25 25 30 35 40 45 50 55 trep from deep sequencing 0.8 0.6 0.4 wt A wt B ARS1-∆B2 A ARS1-∆B2 B 0.2 0.0 G2 0 20 40 60 80 C Fraction replicated G2 D Fraction replicated G1 Fraction replicated 1.0 1.0 0.8 0.6 ARS1 ARS1218 ARS415 ARS1226 ARS501 ARS316 ARS603 ARS601 0.4 0.2 0.0 0 20 40 60 80 1.0 0.8 ARS1-∆B2 ARS1218 ARS415 ARS1226 ARS501 ARS316 ARS603 ARS601 0.6 0.4 0.2 0.0 0 20 40 60 Time after G1 release (minutes) 80


