Variation in Shrub and Herb Cover and Production on Ungrazed Pine
advertisement
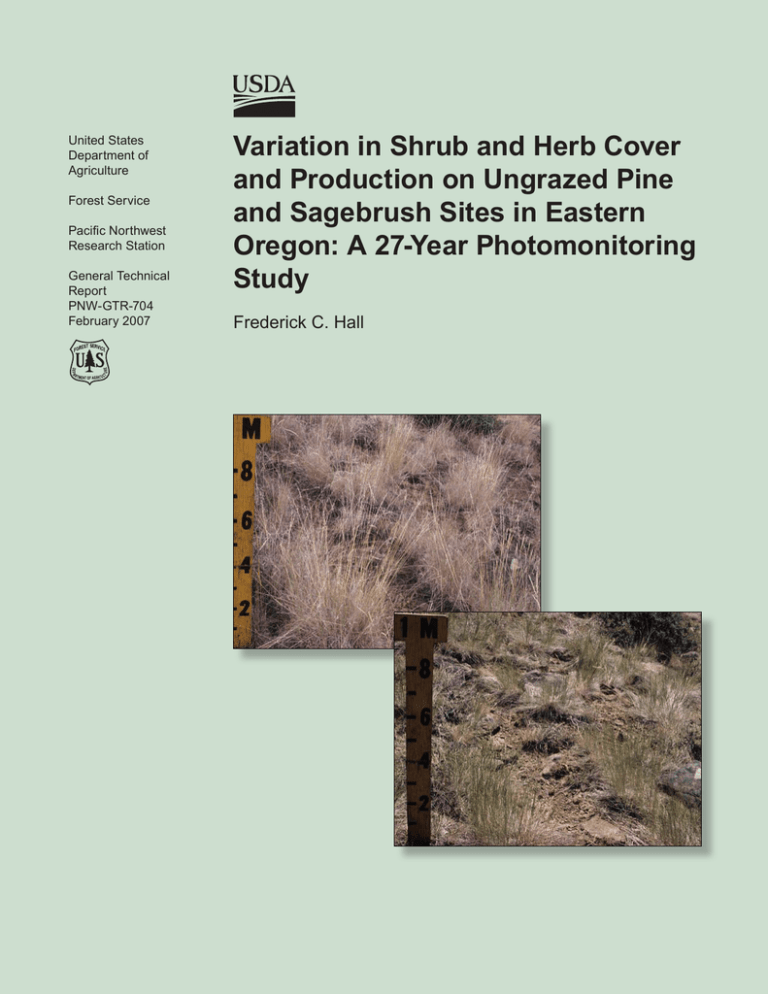
United States Department of Agriculture Forest Service Pacific Northwest Research Station General Technical Report PNW-GTR-704 February 2007 Variation in Shrub and Herb Cover and Production on Ungrazed Pine and Sagebrush Sites in Eastern Oregon: A 27-Year Photomonitoring Study Frederick C. Hall The Forest Service of the U.S. Department of Agriculture is dedicated to the principle of multiple use management of the Nation’s forest resources for sustained yields of wood, water, forage, wildlife, and recreation. Through forestry research, cooperation with the States and private forest owners, and management of the National Forests and National Grasslands, it strives—as directed by Congress—to provide increasingly greater service to a growing Nation. The U.S. Department of Agriculture (USDA) prohibits discrimination in all its programs and activities on the basis of race, color, national origin, age, disability, and where applicable, sex, marital status, familial status, parental status, religion, sexual orientation, genetic information, political beliefs, reprisal, or because all or part of an individual’s income is derived from any public assistance program. (Not all prohibited bases apply to all programs.) Persons with disabilities who require alternative means for communication of program information (Braille, large print, audiotape, etc.) should contact USDA’s TARGET Center at (202) 720-2600 (voice and TDD). To file a complaint of discrimination, write USDA, Director, Office of Civil Rights, 1400 Independence Avenue, SW, Washington, DC 20250-9410 or call (800) 795-3272 (voice) or (202) 720-6382 (TDD). USDA is an equal opportunity provider and employer. Author Frederick C. Hall was senior ecologist (now retired), U.S. Department of Agriculture, Forest Service, Pacific Northwest Region, Natural Resources, P.O. Box 3623, Portland, OR 97208-3623. This paper was prepared in cooperation with the Pacific Northwest Region. Cover photos The photos on the cover depict the change in vegetation, from one year to the next, at the same sample point. The top photo was taken in 1994 and the bottom photo was taken one year later in 1995. Photos by Frederick C. Hall. Abstract Hall, Frederick C. 2007. Variation in shrub and herb cover and production on ungrazed pine and sagebrush sites in eastern Oregon: a 27-year photomonitoring study. Gen. Tech. Rep. PNW-GTR-704 Portland, OR: U.S. Department of Agriculture, Forest Service, Pacific Northwest Research Station. 44 p. Study objectives were to evaluate yearly fluctuations in herbage canopy cover and production to aid in defining characteristics of range condition guides. Sites are located in the forested Blue Mountains of central Oregon. They were selected from those used to develop range condition guides where soil, topographic, and vegetation parameters were measured as a characterization of best range condition. Plant community dominants were ponderosa pine/pinegrass, ponderosa pine/bitterbrush/ Idaho fescue savanna, low sagebrush/bluebunch wheatgrass, and rigid sagebrush scabland. None of the sites were grazed during the previous 30 years or during the 27-year study. Each location was permanently marked by fence posts, and a meter board was placed 10 m down an established transect line. Photographs (color slides) were taken down the transect with closeups left and right of the meter board. Sampling was limited to August 1–4 each year when canopy cover and herbage production were determined. Both total canopy cover and herbage production varied by about a 2.4-fold difference on each site over the 27 years. Apparently “good range condition” may be something of a “running target” and lacks a well-defined set of parameters. Canopy cover is a poor parameter for characterizing range condition. Three of the four plant communities were dominated by bunchgrasses. Abundance of seedheads is commonly used to indicate good range health. But on these sites, seedheads were not produced about half the time. Because these sites were in “good range condition,” lack of seedhead production may indicate maximum competition in the community. Maximum competition and maximum vigor do not seem to be synonymous. These bunchgrass communities varied in their greenness on the first of August each year from cured brown to rather vibrant green suggesting important annual differences in phenology. The pinegrass community, being dominated by rhizomatous species, showed surprising variance in seedhead production. Pinegrass did not flower, but Wheeler’s bluegrass, lupine, and Scouler’s woolyweed were quite variable, averaging inflorescences only 75 percent of the time. Keywords: Range condition, flowering, canopy cover, herbage production, bunchgrass, yearly variability. Contents 1 Introduction 1 Plant Communities 2 Methods 2 Photomonitoring 2 Canopy Cover 3 Herbage Production 3 Image Identification 3 Photomonitoring 4 Viewing Images 5 Ponderosa Pine/Pinegrass Site: Herbage Dominance and Production 10 Comments 13 Ponderosa Pine/Bitterbrush/Idaho Fescue Site: Herbage Dominance and Production 20 Comments 23 Low Sagebrush/Bluebunch Wheatgrass Site: Herbage Dominance and Production 28 Comments 31 Rigid Sagebrush Scabland Site: Herbage Dominance and Production 36 Comments 39 Summary 39 Canopy Cover 39 Ratio of Cover to Productivity 39 Image Evaluation 41 Species List: Common Names 42 Species List: Codes 42 English Equivalents 43 Literature Cited Variation in Shrub and Herb Cover and Production on Ungrazed Pine and Sagebrush Sites in Eastern Oregon Introduction Use of range condition guides presupposes that vegetation characteristics of good condition are reasonably consistent from year to year. The validity of this concept warrants consideration because it forms the basis for determining fair and poor range condition as part of an appraisal of range health, which determines the need for livestock adjustment. Seventeen sites representative of common range plant communities in the Blue Mountains of eastern Oregon were monitored August 1 to 4 from 1976 to 2006 for yearly changes in species dominance and herbage production at a consistent time of year. They were selected from those sites sampled to develop range condition guides by using the 3-Step Method (Parker and Harris 1959). Plant Communities Four common plant communities were chosen for this report: ponderosa pine/pinegrass, ponderosa pine/bitterbrush/Idaho fescue savanna, low sagebrush/bluebunch wheatgrass, and rigid sagebrush scabland.1 Data show that there is variability in species canopy cover and total herbage production between years. The data raise questions about the concept of a single set of criteria for “good” in range condition guides. The data also raise questions about what kind of sampling system is appropriate for characterizing these guides. Ponderosa pine/pinegrass, often with Douglas-fir and grand fir, is the most widespread forested plant community, that is also grazed, east of the Cascade crest in both Oregon and Washington. As tree cover increases, shrub and herb species density, composition, and production decreases (USDA FS 1967a). Ponderosa pine/bitterbrush/Idaho fescue is the second most common forested plant community that is grazed east of the Cascade crest. It represents the transition from grassland or sagebrush to forest as precipitation increases. And it, like ponderosa/pinegrass, suffers from a reduction of herbaceous species with an increase in tree cover. But it occupies a unique place in forested rangeland. Tree density for 1-in diameter growth per decade (Hall 2004) is so low that tree canopy, at this density, does not significantly affect herbaceous cover or production. However, tree cover in stagnated stands does reduce herbage production. Tree density also affects tree growth in both height and diameter. Grass canopy cover can reach 70 percent and herbage production 400 kg/ha. Low sagebrush/bluebunch wheatgrass, the third most widespread plant community, occurs within the forest zone on soils too shallow for pine or fir. Juniper 1 See “Species List” for Latin names of species in this publication. General TEchnical REport PNW-GTR-704 can colonize these sites. Grass seedhead production on these areas is a trait evaluated by photo interpretation. The parameter evaluated is the number of bunchgrass plants that flowered by August 1. Canopy cover can reach 70 percent and herbage production 600 kg/ha. Rigid sagebrush scabland was the fourth most widespread kind of plant community studied. It occurs within the forest zone on very shallow soils, 1.5 to 3.0 dm deep, on poorly cracked bedrock. Soils are so shallow that they become waterlogged during winter. Soil protection is afforded by a gravel and stony cover with biological species such as moss and lichens intertwined. Herbaceous cover may reach 45 percent and production 250 kg/ha. Methods August 1 to 4 was established as the time of year to sample. It was established as a reference point for plant phenological development including greenness, seedhead production, canopy cover, and herbage production. Photomonitoring Photomonitoring (Hall 2002) was used to illustrate yearly changes based on recommendations by Reppert and Francis (1973) in their appraisal of the 3-Step Method. Their procedure was adapted as follows: (1) Each site was identified with steel fence posts or concrete reinforcing bars in rigid sagebrush sites. (2) The camera location was placed at the 0-ft end of the original range condition sampling transect. (3) A board 1 meter tall and marked in even decimeters was placed at the 10-m (33-ft) transect location and three images were recorded: a general view from the 0-ft end of the tape, and two at 2 m from the board, a view left of the meter board, and a view right of the board. These were used to appraise seedhead production, change in soil surface conditions, greenness of the vegetation, and as a check on estimates of canopy cover. Because of space limitations, only the right meter board image has been used. Canopy Cover At each side of the meter board a 1-m square plot frame was placed to document canopy cover and estimate total herbage production. One decimeter marks were placed at each corner of the meter square to facilitate canopy estimates as a 1-dm square is 1 percent cover. Continuous vegetation (no open space) over at least 66 percent of the 1-dm square constitutes 1 percent cover. Variation in Shrub and Herb Cover and Production on Ungrazed Pine and Sagebrush Sites in Eastern Oregon Herbage Production Herbage production was also estimated by using the 1-dm square. Near the sample site, a 1-m square area was selected on which to adjust ocular herbage production estimates. The area would be estimated and then clipped to measure grams of dry matter. To focus attention on plant biomass, a 1-dm square area around each plant was evaluated to determine how many 1-square dm areas were covered by a plant; then grams were estimated. This simply focused my attention on plant biomass. Herbage samples were air dried. Other observations were noted at each site. Subsequent careful observation of recorded images revealed items missed in the field. I was surprised at how much could be “seen” by comparing images year by year. Rocks “moved,” trees came and went, bunchgrass plants shifted location, foliage color changed, foliage length varied, and seedheads were amazingly variable by number of plants, by number per plant, and by shift in plant location. Image Identification The USDA Forest Service Pacific Northwest Region has developed a system for archiving images, mostly color slides. About 5,000 long-term study slides have been identified and categorized to be made available online. All images used here have been identified by a code consisting of an alphanumeric site identification. For example, the ponderosa pine/bitterbrush/Idaho fescue site code is 203EPF identifying ecology plot 203 and is read as “plot 203 ecology plot forage.” Tables in this publication use the archiving codes to facilitate access to the slides. Photomonitoring All images used here are the same colors found on the slides. In no case was color altered. A few times brightness was altered to modify effects of shadows. Note that images from 1957 to 1960 show effects of color fade. Kodak Ektachrome 2 was used in preference to Kodachrome because the latter gave too much red and an unrealistic color to vegetation. Ektachrome ISO was 100 in 1957 and 200 after 1966. Capturing the subtleties of greenness in August proved to be a challenge. The degree of greenness varied considerably. Use of firm or trade names in this publication is for reader information and does not imply endorsement by the U.S. Department of Agriculture of any product or service. 2 General TEchnical REport PNW-GTR-704 Camera technique was important in comparing images (Hall 2002). First, both camera location and photopoint at the meter board must be permanently marked with steel fence posts or stakes. The meter board for general pictures was used to orient the camera by focusing on the “1M.” Then it was used to photograph a specific tract of ground for repeat images. This requires another camera location in front of the board. For camera focal length of 50mm, the camera was held 2 m from the board. The camera was oriented to place the board at one side of the image so it reached from top to bottom. Digital cameras usually have zoom lenses so distance is very critical if any kind of change is to be documented. For general images, the zoom was adjusted to show the meter board at 25 percent of the image height. For the closeup images, the camera is oriented 2 m in front of the board and zoomed to just fill the one side of the image with the board. Viewing Images Each of the following four sections is organized with an introductory page followed by four pages of images to the right of the meter board. When the pages are opened, one can view 12 years. Read from left to right across both pages. Variation in Shrub and Herb Cover and Production on Ungrazed Pine and Sagebrush Sites in Eastern Oregon Ponderosa Pine/Pinegrass Site: Herbage Dominance and Production This site is located at the south edge of Big Summit Prairie, Lookout Mountain District, Ochoco National Forest. The area was historically a sheep allotment but was converted to a cattle allotment after the Second World War. It was selected because both woody and herbaceous vegetation seem near site potential for the area (USDA FS 1967a). All sampling was done between August 1 and 4 starting in 1979 to the present. All images are shown as they appear on color slides of Kodak Ektachrome, ISO 200. In 1986, the roll of film was overexposed and the images are not presented here. The intent was to show yearly differences in both species dominance and seasonal color. 1979: The ponderosa pine/pinegrass site during a drought. The log to the right of the meter board appears in all subsequent images of herbage species. Note the slight differences in dominance of pinegrass. This is due to variation in Mazama ash depth. Less ash means less vigor of pinegrass and more vigor of elk sedge. The image for 1986 is not included. 1979: View right of the meter board: pinegrass 40 percent cover, elk sedge 10 percent, and dried lupine 10 percent cover; 300 kg/ha herbage production. A pine seedling is next to the meter board between 6 and 8 dm. It was missing by 1982. Soil profile shows ash depth of 0.5 to 0.6 m over a buried soil. Basalt bedrock produced a moderately stony clay-loam soil. General TEchnical REport PNW-GTR-704 1980: Percent cover: pinegrass 55, elk sedge 20, lupine 15, Wheeler’s bluegrass 5; herbage production 650 kg/ha. 1981: Percent cover: pinegrass 50, elk sedge 25, Wheeler’s bluegrass 25 (seed heads), no lupine; herbage production 550 kg/ha. 1984: Percent cover: pinegrass 55, lupine 30 (white seed heads), elk sedge 20; herbage production 600 kg/ha. 1985: Percent cover: pinegrass 35, lupine (dry) 30, elk sedge 15, Scouler’s woolyweed 5; herbage production 425 kg/ha. 1989: Percent cover: pinegrass 45, lupine 25 (white seed heads), elk sedge 20; herbage production 500 kg/ha. 1990: Percent cover: pinegrass 60, Wheeler’s bluegrass 15 (seed heads), Scouler’s woolyweed 5; herbage production 600 kg/ha. Variation in Shrub and Herb Cover and Production on Ungrazed Pine and Sagebrush Sites in Eastern Oregon 1982: Percent cover: pinegrass 40, lupine 20, elk sedge 15, Wheeler’s bluegrass 5; herbage production 450 kg/ha. Pine now dead. 1983: Percent cover: pinegrass 50, elk sedge (dark green) 25, herbage production 400 kg/ha. Pine seedlings top right near log. 1987: Percent cover: pinegrass 40, lupine 25, elk sedge 20; herbage production 500 kg/ha. 1988: Percent cover: pinegrass 55, lupine 35 (brown), Scouler’s woolyweed 10; herbage production 600 kg/ha. 1991: Percent cover: pinegrass 55, lupine 20, Wheeler’s bluegrass 10, Scouler’s woolyweed 15; herbage production 600 kg/ha. 1992: Percent cover: pinegrass 40, lupine 10, Wheeler’s bluegrass 20; herbage production 500 kg/ha. Pine seedlings top right. General TEchnical REport PNW-GTR-704 1993: Percent cover: pinegrass 55, lupine 15, Wheeler’s bluegrass 10, elk sedge 10; herbage production 675 kg/ha. 1994: Percent cover: pinegrass 55, Wheeler’s bluegrass 20, elk sedge 10, lupine 2; herbage production 600 kg/ha. 1997: Percent cover: pinegrass 70, Wheeler’s bluegrass 20, lupine 10, elk sedge 10; herbage production 675 kg/ha. 1998: Percent cover: pinegrass 55, Wheeler’s bluegrass 20, lupine 15, Scouler’s woolyweed 8; herbage production 500 kg/ha. 2001: Percent cover: pinegrass 55, Wheeler’s bluegrass 15, lupine 15, Scouler’s woolyweed 5; herbage production 500 kg/ha. 2002: Percent cover: pinegrass 40, Scouler’s woolyweed 10, lupine 10; herbage production 450 kg/ha. Pine seedlings top right. Variation in Shrub and Herb Cover and Production on Ungrazed Pine and Sagebrush Sites in Eastern Oregon 1995: Percent cover: pinegrass 40, Scouler’s woolyweed 10, lupine 10; herbage production 500 kg/ha. Pine seedlings top right near log. 1996: Percent cover: pinegrass 70, Wheeler’s bluegrass 20, Scouler’s woolyweed 5; herbage production 600 kg/ha. 1999: Percent cover: pinegrass 40, lupine 10, Scouler’s woolyweed 5; herbage production 400 kg/ha. 2000: Percent cover: pinegrass 50, Wheeler’s bluegrass 20, Scouler’s woolyweed 10, no lupine; herbage production 550 kg/ha. 2003: Percent cover: pinegrass 40, Scouler’s woolyweed 10, lupine 10, Wheeler’s bluegrass 10; herbage production 400 kg/ha. 2004: Percent cover: pinegrass 45, Wheeler’s bluegrass 25, Scouler’s woolyweed 10, elk sedge 10; herbage production 450 kg/ha. General TEchnical REport PNW-GTR-704 2005: View of the pine/pinegrass site after 27 years. The regenerating pines shown in 1983, 1992, 1995, and 2002 are just behind the end of the log and about 2 m tall after about 25 years. Root competition from dominant pines has greatly reduced height growth, which should be about 6 m on this site index of 23 m. Difference in density of pinegrass, the dominant herb, is caused by variation in ash depth over the buried soil. The image for 1979 shows less contrast because the drought limited height of pinegrass. 2005: Percent cover: pinegrass 40, Wheeler’s bluegrass (seedheads) 20, elk sedge 10, Scouler’s woolyweed 8; herbage production 450 kg/ha. Pine seedlings at the top-right are now only saplings after 25 years. A crude estimate of herbage production may be obtained by multiplying total herbage cover by a factor of 6.2. For the example above: 40 + 20 + 10 + 8 = 78; 78 X 6.2 = 483 kg/ha. Comments Over a 26-year period (data from table 1-BSPCF-ponderosa pine/pinegrass): • Pinegrass, the dominant species, varied from 35 to 55 percent cover, a 1.5-fold difference, which was not affected by livestock utilization. This variation suggests that estimation of range condition by use of canopy cover is questionable. • Sampling of vegetation to estimate range condition should consider methods that are sensitive to species presence as well as dominance. For example, lupine was measurable for canopy cover only 73 percent of the time, • • 10 yet it was still rooted in the plant community. During good lupine growing conditions, it attained 25 to 35 percent canopy cover and produced heavy seeds enhancing herbage production. Total herbage production averaged 520 kg/ha but varied from 300 to 675 kg/ ha, a 2.25-fold difference on the same good range condition site. Exercise caution when estimating allotment carrying capacity based on range condition. Only pinegrass had measurable canopy cover 100 percent of the time. Four other species, lupine, Scouler’s woolyweed, elk sedge, and Wheeler’s bluegrass were evident only 65 to 75 percent of the time. They were present but not measurable for canopy cover or herbage production. This situation should be considered when describing vegetation characteristics for range condition guides. Variation in Shrub and Herb Cover and Production on Ungrazed Pine and Sagebrush Sites in Eastern Oregon Table 1-BSPCF—Ponderosa pine/pinegrass. Yearly canopy cover by species and statistics on total yearly canopy cover, herbage production, and ratio of production to canopy cover Canopy cover by species codea Year CARU LUCA HISC2 CAGE2PONE2NOTR2ARCO9 Herb cover Percent kg/ha Ratio Percent Herbage Ratio cover/ production kg/ha 1979 1980 1981 1982 1983 1984 1985 1987 1988 1989 1990 1991 1992 1993 1994 1995 1996 1997 1998 1999 2000 2001 2002 2003 2004 2005 40 10 50 25 50 40 20 50 55 30 35 30 40 25 55 35 45 25 60 45 20 40 10 45 15 45 1 40 10 50 50 10 45 15 40 10 50 55 15 40 10 40 10 50 40 18 20 5 25 2 10 25 15 2 20 10 5 25 1 20 5 15 20 10 1 1 20 5 1 15 5 1 10 5 1 20 5 10 10 10 20 10 5 1 20 5 10 20 8 20 5 10 20 5 15 10 10 10 10 25 8 10 30 60 95 100 80 75 105 85 85 100 90 81 90 70 90 87 60 60 95 98 60 80 90 60 70 90 83 300 550 650 450 400 600 450 500 600 500 600 600 500 675 600 500 600 675 500 400 550 500 450 400 550 450 5.0 5.8 6.5 5.6 5.3 5.7 5.0 5.9 6.0 5.6 7.5 6.7 7.1 7.5 6.9 8.3 6.3 7.1 5.1 6.7 6.9 5.6 7.5 5.7 6.1 5.1 Mean Count Percent 46.0 26 100 6.8 18 69 83.8 13.5 5.2 520.2 94.6 36.4 6.2 0.9 0.4 18.1 19 73 13.1 18 69 15.4 17 65 3.5 2 8 7.5 Mean 2 SD 8 5% CI Note: SD = standard deviation; CI = confidence interval. a See “Species List: Codes” for plant code definitions. 11 Variation in Shrub and Herb Cover and Production on Ungrazed Pine and Sagebrush Sites in Eastern Oregon Ponderosa Pine/Bitterbrush/Idaho Fescue Site: Herbage Dominance and Production This study was placed on ecology plot number 203 installed in 1957 to measure vegetation and soil attributes for development of range condition guides (USDA FS 1967b). It is located on the Lookout Mountain District, Ochoco National Forest, on the east edge of Big Summit Prairie. All sampling was done between August 1 and 4 each year starting in 1977 to the present. 1957: The ponderosa/bitterbrush/fescue community in 1957 with small, sapling sized ponderosa regeneration, hedged bitterbrush, and vigorous fescue. Color in the slide has faded over 45 years. Soil is Mazama ash over basalt-derived residual soil. A 9-in finger spread was replaced by a meter tape for subsequent images. Total soil depth was 0.6 m. 1978: Same stand in 1978 when this study was initiated. Pine saplings have only grown about 6 dm in 20 years. The area was underburned in spring 2002 when the log left rear of the meter board was consumed. A precommercial thinning was applied in 2003. 1978: Idaho fescue is the dominant herb. The foreground individual has produced abundant seed stalks. Compare to following images. It was killed by the prescribed burn of 2002. 13 General TEchnical REport PNW-GTR-704 1979: No seedheads; percent cover: Idaho fescue 20, squirreltail 5, wheatgrass 5; herbage production 300 kg/ha. 1980: No seedheads; percent cover: fescue 15, wheatgrass 5, Ross sedge 2, squirreltail 2; herbage production 250 kg/ha. 1983: No seedheads; percent cover: fescue 15, wheatgrass 2, Ross sedge 2, pussytoes 2; herbage production 200 kg/ha. 1984: No seedheads; percent cover: fescue 15, Ross sedge 2, needlegrass 2, yarrow 1; herbage production 225 kg/ha. 1987: 50 percent seedheads; percent cover: fescue 15, wheatgrass 8, needlegrass 3, junegrass 2; herbage production 250 kg/ha. 1988: No seedheads; percent cover: fescue 15, wheatgrass 2, squirreltail 2, Ross sedge 2; herbage production 200 kg/ha. 14 Variation in Shrub and Herb Cover and Production on Ungrazed Pine and Sagebrush Sites in Eastern Oregon 1981: 60 percent seedheads; percent cover: fescue 25, wheatgrass 7, needlegrass 2; herbage production 350 kg/ha. 1982: 10 percent seedheads; percent cover: fescue 25, wheatgrass 2, lupine 5, pussytoes 2, herbage production 300 kg/ha. 1985: No seedheads; percent cover: fescue 20, Japanese brome 8 (heads), squirreltail 5; herbage production 325 kg/ha. 1986: No seedheads, percent cover: fescue 12, wheatgrass 2, pussytoes 1, Ross sedge 1; herbage production 150 kg/ha. 1989: 20 percent seedheads; percent cover: fescue 18, wheatgrass 2, squirreltail 3, bluegrass 2; herbage production 235 kg/ha. 1990: No seedheads; percent cover: fescue 20, wheatgrass 5, junegrass 2, Ross sedge 2; herbage production 300 kg/ha. click here to continue to page 16 of document 15
