CO and Heat Flux Observations in Suburban Baltimore (Cub Hill) 2 Sue Grimmond
advertisement
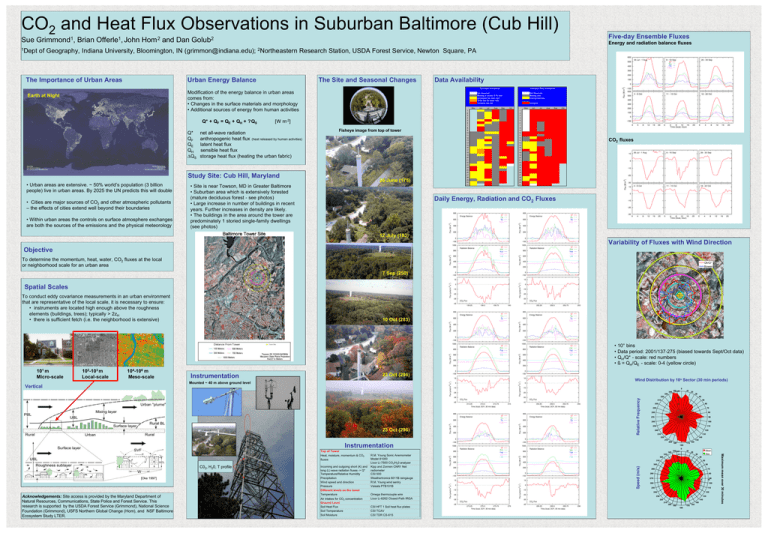
CO2 and Heat Flux Observations in Suburban Baltimore (Cub Hill) Five-day Ensemble Fluxes Sue Grimmond1, Brian Offerle1, John Hom 2 and Dan Golub2 1Dept Energy and radiation balance fluxes of Geography, Indiana University, Bloomington, IN (grimmon@indiana.edu); 2Northeastern Research Station, USDA Forest Service, Newton Square, PA The Importance of Urban Areas Urban Energy Balance The Site and Seasonal Changes Data Availability Flux Data Availability Modification of the energy balance in urban areas comes from: • Changes in the surface materials and morphology • Additional sources of energy from human activities Earth at Night Q* + QF = QE + QH + ?QS Q* QF QE QH ∆QS Not Observed Missing or invalid 10 Hz data Incomplete day (rain, etc.) 10 Hz data for sonic only Complete day, QA May [W m-2] net all-wave radiation anthropogenic heat flux (heat released by human activities) latent heat flux sensible heat flux storage heat flux (heating the urban fabric) Fisheye image from top of tower Credit: C. Mayhew & R. Simmon (NASA/GSFC), NOAA/ NGDC, DMSP Digital Archive Study Site: Cub Hill, Maryland • Urban areas are extensive. ~ 50% world’s population (3 billion people) live in urban areas. By 2025 the UN predicts this will double • Cities are major sources of CO2 and other atmospheric pollutants – the effects of cities extend well beyond their boundaries • Within urban areas the controls on surface atmosphere exchanges are both the sources of the emissions and the physical meteorology Ancillary Data Availability 26 June (175) • Site is near Towson, MD in Greater Baltimore • Suburban area which is extensively forested (mature deciduous forest - see photos) • Large increase in number of buildings in recent years. Further increases in density are likely. • The buildings in the area around the tower are predominately 1 storied single-family dwellings (see photos) 1 2 3 4 5 6 7 8 9 10 11 12 13 14 15 16 17 18 19 20 21 22 23 24 25 26 27 28 29 30 31 Jun Jul Aug Sep Not Observed Missing data Only ground data Complete Oct May Jun Jul Aug Sep 1 2 3 4 5 6 7 8 9 10 11 12 13 14 15 16 17 18 19 20 21 22 23 24 25 26 27 28 29 30 31 Oct CO2 fluxes Daily Energy, Radiation and CO2 Fluxes 12 July (193) Variability of Fluxes with Wind Direction Objective To determine the momentum, heat, water, CO2 fluxes at the local or neighborhood scale for an urban area Qh/Q* Bowen .8 7 Sep (250) .6 .4 Spatial Scales .2 To conduct eddy covariance measurements in an urban environment that are representative of the local scale, it is necessary to ensure: • instruments are located high enough above the roughness elements (buildings, trees); typically > 2zH • there is sufficient fetch (i.e. the neighborhood is extensive) .0 10 Oct (283) • • • • 101 m Micro-scale 102-103 m Local-scale 104-106 m Meso-scale 23 Oct (296) Instrumentation Wind Distribution by 10o Sector (30 min periods) Mounted ~ 40 m above ground level Vertical 10° bins Data period: 2001/137-275 (biased towards Sept/Oct data) QH/Q* - scale: red numbers ß = QH/QE - scale: 0-4 (yellow circle) 0 340 350 .04 10 20 330 30 23 Oct (296) Relative Frequency 320 40 .03 310 50 300 60 .02 290 70 .01 280 80 270 .00 90 260 100 250 110 240 120 230 130 220 140 210 200 Instrumentation [Oke 1997] Acknowledgements: Site access is provided by the Maryland Department of Natural Resources, Communications, State Police and Forest Service. This research is supported by the USDA Forest Service (Grimmond), National Science Foundation (Grimmond), USFS Northern Global Change (Hom), and NSF Baltimore Ecosystem Study LTER. Incoming and outgoing short (K) and long (L) wave radiation fluxes -> Q* Temperature/Relative Humidity Precipitation Wind speed and direction Pressure Different levels on the tower Temperature Air intakes for CO2 concentration Ground Level Soil Heat Flux Soil Temperature Soil Moisture 160 0 350 4.5 330 10 4 3.5 3 2.5 2 1.5 1 0.5 0 320 310 300 Speed (m/s) C02, H20, T profile 170 180 340 R.M. Young Sonic Anemometer Model 81000 Licor Li-7500 CO2/H20 analyzer Kipp and Zonnen CNR1 Net radiometer CSI 500 Weathertronics 6011B raingauge R.M. Young wind sentry Vaisala PTB101B 190 290 280 270 Mean Max 20 30 40 50 60 70 80 3 6 90 12 9 260 100 250 110 240 Omega thermcouple wire Licor Li-6262 Closed-Path IRGA 120 230 130 220 140 210 150 200 CSI HFT 1 Soil heat flux plates CSI TCAV CSI TDR CS-615 190 170 180 160 Maximum mean over 30 minutes Top of Tower Heat, moisture, momentum & CO2 fluxes 150
