All exercises today will be real-life applications of finding probabilities
advertisement

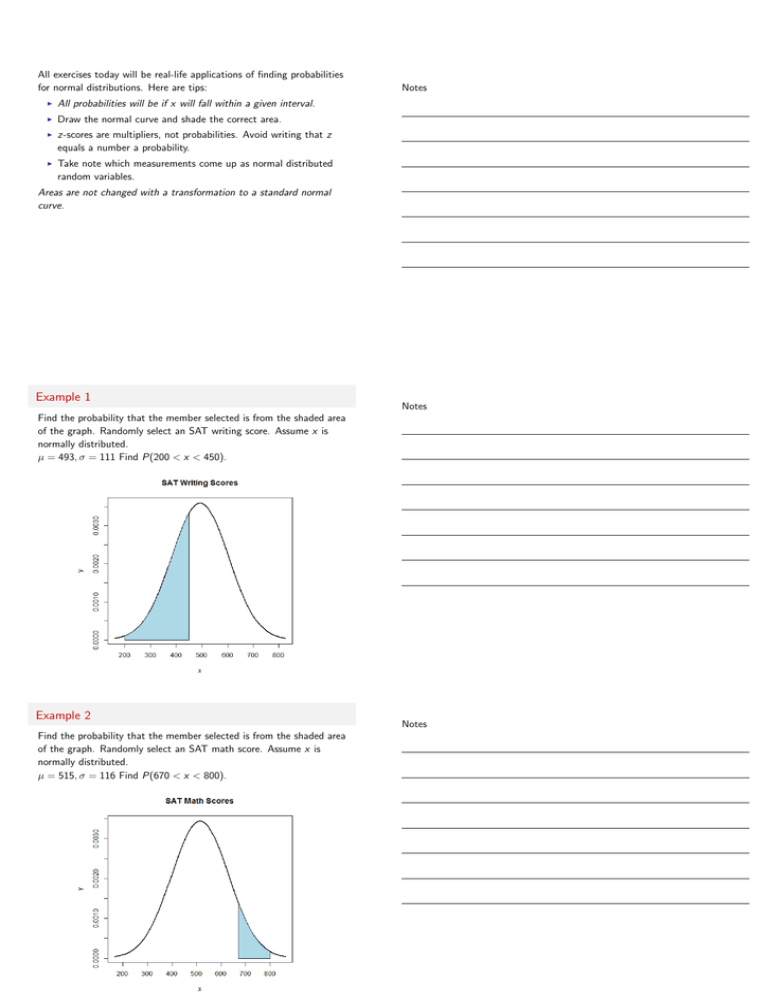
All exercises today will be real-life applications of finding probabilities for normal distributions. Here are tips: I All probabilities will be if x will fall within a given interval. I Draw the normal curve and shade the correct area. I z-scores are multipliers, not probabilities. Avoid writing that z equals a number a probability. I Take note which measurements come up as normal distributed random variables. Notes Areas are not changed with a transformation to a standard normal curve. Example 1 Notes Find the probability that the member selected is from the shaded area of the graph. Randomly select an SAT writing score. Assume x is normally distributed. µ = 493, σ = 111 Find P(200 < x < 450). Example 2 Find the probability that the member selected is from the shaded area of the graph. Randomly select an SAT math score. Assume x is normally distributed. µ = 515, σ = 116 Find P(670 < x < 800). Notes Example 3 Notes Find the probability that the member selected is from the shaded area of the graph. Randomly select a U.S. man’s total cholesterol. Assume x is normally distributed. µ = 209, σ = 37.8 Find P(220 < x < 255). Example 4 Notes Find the probability that the member selected is from the shaded area of the graph. Randomly select a U.S. woman’s total cholesterol. Assume x is normally distributed. µ = 197, σ = 37.7 Find P(190 < x < 215). Example 5 A survey indicates that people use their mobile phones an average of 1.5 years before buying an upgrade. The standard deviation is 0.25 years. A mobile phone user is selected at random. Find the probability that the user will use their phone for less than 1 year before buying a new one. Notes Example 6 Notes A survey indicates that for each trip to the supermarket, a shopper spends an average of 45 minutes with a standard deviation of 12 minutes in the store. The lengths of time are normally distributed and represented by the variable x. A shopper enters the store. What is the probability that the shopper will be in the store between 24 and 54 minutes? What is the probability that the shopper will be in the store more than 39 minutes? Interpret the answers if 200 shoppers enter the store. How many shoppers would you expect to be in the store for each interval of time? Example 7 Notes Triglycerides are a type of fat in the bloodstream. The mean triglyceride level in the U.S. is 134 milligrams per deciliter. Assume the triglyceride levels of the population of the U.S. are normally distributed, with a standard deviation of 35 milligrams per deciliter. You randomly select a person from the U.S. What is the probability that the person’s triglyceride level is less than 80? Assignment I §5.2: 11, 12, 16, 18, 21, 22, 26 Notes


