STATISTICS 401B Fall 2014 Laboratory Assignment 4
STATISTICS 401B
Laboratory Assignment 4
Fall 2014
For problems 1 and 2, consider again the population of places rated data given in Lab 2.
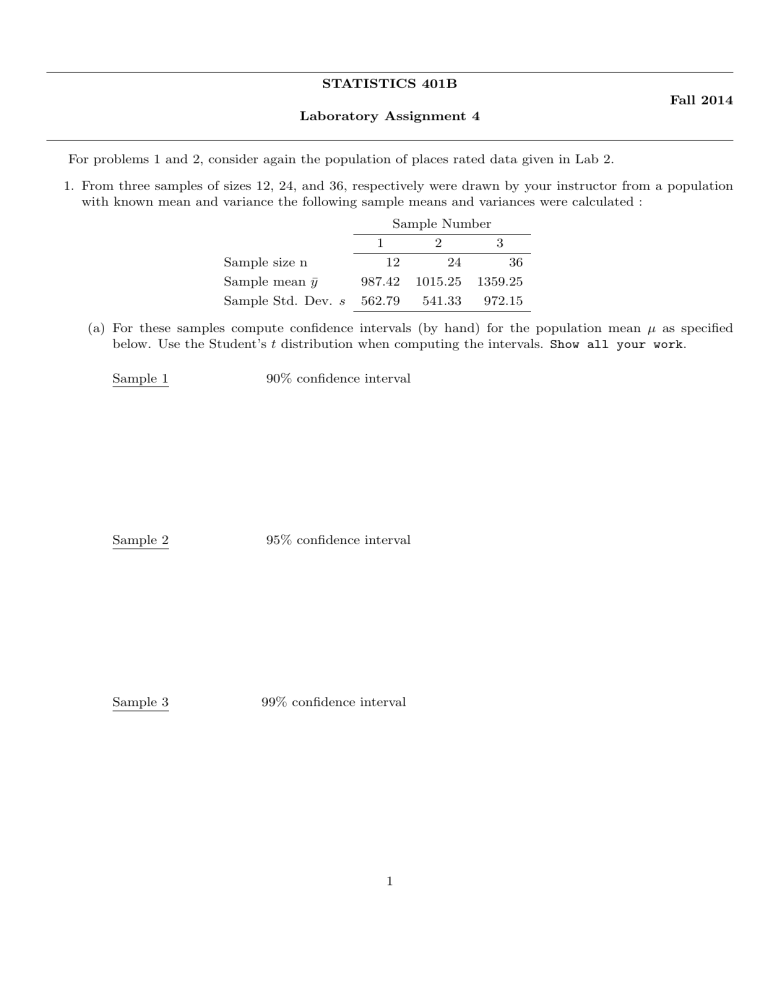
1. From three samples of sizes 12, 24, and 36, respectively were drawn by your instructor from a population with known mean and variance the following sample means and variances were calculated :
1
Sample Number
2 3
Sample size n 12 24 36
987.42
1015.25
1359.25
Sample Std. Dev.
s 562.79
541.33
972.15
(a) For these samples compute confidence intervals (by hand) for the population mean µ as specified below. Use the Student’s t distribution when computing the intervals.
Show all your work .
Sample 1 90% confidence interval
Sample 2 95% confidence interval
Sample 3 99% confidence interval
1
(b) For the samples compute the t -test statistic and conduct tests of hypotheses using the t-table as specified below. State your decisions clearly. Also, approximate or bound the p-value for each test to the nearest value possible using the t-table (Table 2 in your textbook).
Show all your work .
Sample 1 Test H
0
: µ = 900 vs.
H a
: µ = 900 using α = 0 .
1
Sample 2 Test H
0
: µ ≤ 800 vs.
H a
: µ > 800 using α = 0 .
05
Sample 3 Test H
0
: µ ≥ 1500 vs.
H a
: µ < 1500 using α = 0 .
01
2. Links to the JMP data tables of the three samples used in Problem 1 are available on the lab assignment page.
(a) Use JMP to construct 90%, 95%, and, 99% confidence intervals for the population mean µ using each of the three samples, respectively.
(b) Use JMP to compute the t -test statistics and p-values to conduct tests of the population mean µ as stated in Problem 1(b), using each of the three samples, respectively.
Assume σ
2 is unknown. Save the output from the JMP analysis each sample as a single page in Word. Do not need anything in the output other than the relevant plots, Moments and the CI’s, the t-statistics, and the p-values. Circle the p-values for each test and use them to state you decisions from the tests using α values given for each case in Problem 1(b) and write these by hand in each page of output.
2
3. A consumer testing agency wants to evaluate the claim made by a manufacturer of discount tires that its tires can be driven at least 40,000 miles before wearing out. To estimate the average number of miles that can be obtained from the manufacturer’s tires, the agency randomly selects 60 tires from the manufacturer’s warehouse and places them on 15 cars driven by test drivers on a 2-mile oval track. The number of miles
(in thousands of miles) until the tires are determined to be worn out are as follows:
44 , 35 , 40 , 42 , 38 , 37 , 40 , 32 , 39 , 37 , 45 , 36 , 35 , 43 , 42
Note: Use hand calculation for parts (a) to (e). Show work. Use a JMP analysis for answering parts (f) and (g). Turn in the JMP output.
(a) Prepare a table of quantiles of the tire wear data and the standard normal disribution for p values
( i − .
5) / 15, i = 1 , 2 , ..., 15.
(i–.5)/15 Ordered Data z-value
11
12
13
14
15
7
8
9
10
5
6
3
4 i
1
2
(b) Draw the Normal Probability plot using the quantile pairs in part (a). Does it appear that the target population of the life times of tires produced by the manufacturer is approximately Normal? Explain why or why not.
3
(c) Assume that the population of the tire life times is adequately modeled by a Normal distribution.
Construct and interpret a 95% confidence interval for the mean life time µ of tires being produced by the manufacturer. Show all computations.
(d) If the tire manufacturer told the consumer agency that the population standard deviation σ is approximately 5 (in thousands of miles), what is the minimum sample size needed to estimate the population mean life time µ within ± 2500 miles with 95% confidence ? (Assume a normal population for this part. Show all computations.)
(e) Do the data show that the actual population mean life time is less than the claimed value of 40,000 miles? Use α = .
05 to conduct an appropriate statistical test. State the null and alternative hypotheses clearly. Show all computations.
4
(f) Extract the 95% confidence interval for the mean life time µ of tires being produced by this manufacturer from the JMP output. Copy it here and circle it in the JMP output.
(g) Extract the t-statistic from the JMP output for testing the hypothesis you stated in part (e). Obtain the p-value associated with this test from the JMP output and write it here. Circle these in the JMP output.
Due Thursday, October 2nd, 2014(turn-in by 2:20 p.m.)
5
