Last Time GY 305: Geophysics Seismology Seismology (Marine Surveys)
advertisement

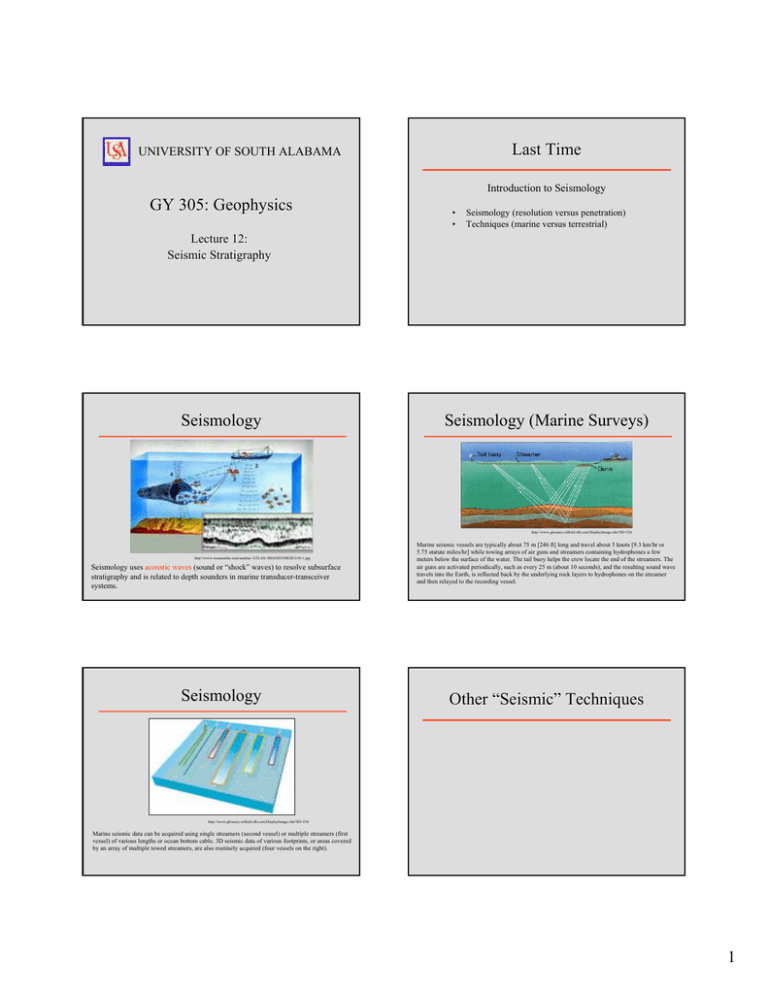
Last Time UNIVERSITY OF SOUTH ALABAMA Introduction to Seismology GY 305: Geophysics • • Seismology (resolution versus penetration) Techniques (marine versus terrestrial) Lecture 12: Seismic Stratigraphy Seismology Seismology (Marine Surveys) http://www.glossary.oilfield.slb.com/DisplayImage.cfm?ID=236 http://www.oceansatlas.com/unatlas/-ATLAS-/IMAGES/HIGH/i156-1.jpg Seismology uses acoustic waves (sound or “shock” waves) to resolve subsurface stratigraphy and is related to depth sounders in marine transducer-transceiver systems. Seismology Marine seismic vessels are typically about 75 m [246 ft] long and travel about 5 knots [9.3 km/hr or 5.75 statute miles/hr] while towing arrays of air guns and streamers containing hydrophones a few meters below the surface of the water. The tail buoy helps the crew locate the end of the streamers. The air guns are activated periodically, such as every 25 m (about 10 seconds), and the resulting sound wave travels into the Earth, is reflected back by the underlying rock layers to hydrophones on the streamer and then relayed to the recording vessel. Other “Seismic” Techniques http://www.glossary.oilfield.slb.com/DisplayImage.cfm?ID=236 Marine seismic data can be acquired using single streamers (second vessel) or multiple streamers (first vessel) of various lengths or ocean bottom cable. 3D seismic data of various footprints, or areas covered by an array of multiple towed streamers, are also routinely acquired (four vessels on the right). 1 Side Scan Sonar Side Scan Sonar Sideways looking sonar developed in the 1960s. Has the ability to locate interesting features on the sea floor http://www.navy.forces.gc.ca/mspa_images/news/story_images/trinity_2.jpg http://www.wisconsinhistory.org/shipwrecks/images/side-scan-sonar-l.jpg http://www.abc.se/~m10354/mar/img/sture/system2.jpg Side Scan Sonar Seafloor mapping Side Scan Sonar Seafloor mapping http://seafloor.csumb.edu/taskforce/html%202%20web/Image6.gif Side Scan Sonar http://seafloor.csumb.edu/taskforce/html%202%20web/Image6.gif High Tech “Sonar” Techniques •GLORIA: First deployed in the 1980’s Iceberg scars of the Newfoundland coast http://www.l-3klein.com/image_gallery/530_images/scours/scours.html 2 High Tech “Sonar” Techniques •GLORIA: First deployed in the 1980’s •Capable of surveying 18,000 km2 per day High Tech “Sonar” Techniques •TOBI: First deployed in the late 1980’s High Tech “Sonar” Techniques •GLORIA: First deployed in the 1980’s •Capable of surveying 18,000 km2 per day •50 m resolution High Tech “Sonar” Techniques •TOBI: First deployed in the late 1980’s •Capable of 70 m penetration High Tech “Sonar” Techniques •TOBI: First deployed in the late 1980’s •Capable of 70 m penetration •2 m resolution Today Seismic Stratigraphy • • • • Sonic Logs (AKA Acoustic logs) Synthetic seismic profiles Seismic sections (how they work) Interpretations of seismic sections (lab stuff) 3 Sonic Logs Sonic Logs •Sonic (acoustic logs) display the travel time of P-waves through a formation. •Travel time through formations is controlled by the density of the rock… •The tool emits a sound wave that travels from the source (T) to the formation and back to receiver(s) (R). •It is used to establish baseline seismic wave transmission data (e.g., to produce synthetic seismic profiles) http://pkukmweb.ukm.my/~rahim/ http://www.spwla.org Sonic Logs Sonic Logs … and depth (velocity/density tend to increase with depth). Ultimately, we are going to have to interpret reflection characteristics of rock units. Consider controls on reflection strength and polarity… http://pangea.stanford.edu/~sklemp/bering_chukchi/images/seismic.section.gif http://www.xsgeo.com/course/images/velan1.gif Recall from an earlier lab… •Acoustic impedance of a formation (1) is simply defined as: Recall from an earlier lab… •Reflection coefficients can be defined as R2 = a2-a1 a2+a1 a1 = v1 x d1 v1 = the velocity of a seismic wave d1 = rock density http://homepage.ufp.pt/biblioteca/GlossarySaltTectonics/PlatesJPG/Fig.A001b-AcousticImpedance.jpg http://homepage.ufp.pt/biblioteca/GlossarySaltTectonics/PlatesJPG/Fig.A001b-AcousticImpedance.jpg 4 Seismology Seismology http://www.searchanddiscovery.net/documents/2004/brown05/images/01.htm Synthetic seismic profiles are made from Sonic logs Seismology Well log data to synthetic seismic seismogram. A. Sonic log. B. Density log. C. Acoustic impedance log. D. Log of seismic reflectivity. E. Broader shape of seismic energy pulse, derived from reflectivity log. F. Synthetic seismogram. Seismology Chalk board http://www.seg.org/about/75/images/full/SEG75_64.jpg Seismic Stratigraphy http://www.seg.org/about/75/images/full/SEG75_64.jpg Seismic Stratigraphy Stratigraphic correlations are made on the basis of strong reflectors Seismic section from the Upper Jurassic North Sea rift basin indicating the development of a syncline in the hanging wall of a large basin-bounding fault zone. This is related to the vertical propagation of the fault. http://www3.imperial.ac.uk/portal/pls/portallive/docs/1/3551902.JPG http://utam.gg.utah.edu/stanford/img63.gif 5 Seismic Stratigraphy Stratigraphic correlations are made on the basis of strong reflectors Seismic Stratigraphy Planar features result in disruptions to reflectors. Spot the faults (2) Beware multiples! http://utam.gg.utah.edu/stanford/img63.gif Seismic Stratigraphy http://www.dmtcalaska.org/exploration/ISU/unit5/images/f25.jpg Seismic Stratigraphy Planar features result in disruptions to reflectors. Spot the faults (2) http://openlearn.open.ac.uk/file.php/2292/S278_1_022i.jpg http://www.dmtcalaska.org/exploration/ISU/unit5/images/f25.jpg 3D Seismic Modeling Upcoming Stuff Due Tomorrow by 5:00PM SP and Gamma Ray Section, Isopach maps, TOF Map, Fence Post Map; Seismology exercises Wednesday’s Lecture, Thursday’s Lab Nothing: Holiday Next Week More Seismic Stratigraphy 3D visualisation in Landmark's GeoprobeTM software illustrating the geometry of a growth fault array from the Columbas Basin, offshore Trinidad. Data courtesy of BP Trinidad. http://www3.imperial.ac.uk/portal/pls/portallive/docs/1/4207902.JPG 6


