GY 112 Lecture Notes
advertisement
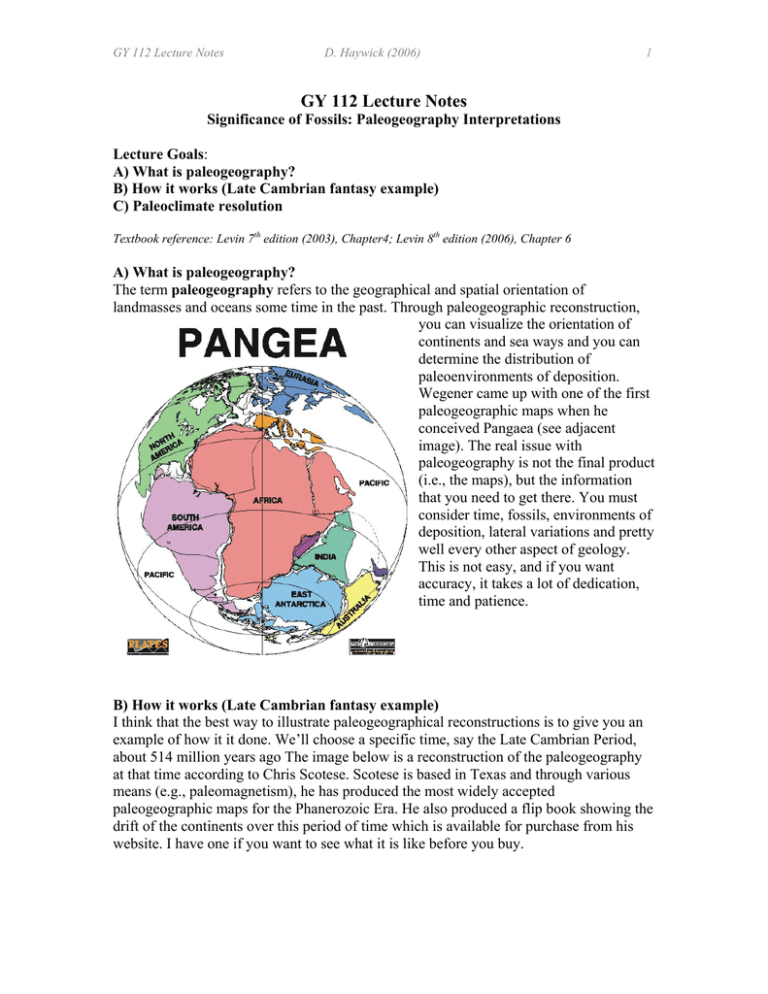
GY 112 Lecture Notes D. Haywick (2006) 1 GY 112 Lecture Notes Significance of Fossils: Paleogeography Interpretations Lecture Goals: A) What is paleogeography? B) How it works (Late Cambrian fantasy example) C) Paleoclimate resolution Textbook reference: Levin 7th edition (2003), Chapter4; Levin 8th edition (2006), Chapter 6 A) What is paleogeography? The term paleogeography refers to the geographical and spatial orientation of landmasses and oceans some time in the past. Through paleogeographic reconstruction, you can visualize the orientation of continents and sea ways and you can determine the distribution of paleoenvironments of deposition. Wegener came up with one of the first paleogeographic maps when he conceived Pangaea (see adjacent image). The real issue with paleogeography is not the final product (i.e., the maps), but the information that you need to get there. You must consider time, fossils, environments of deposition, lateral variations and pretty well every other aspect of geology. This is not easy, and if you want accuracy, it takes a lot of dedication, time and patience. B) How it works (Late Cambrian fantasy example) I think that the best way to illustrate paleogeographical reconstructions is to give you an example of how it it done. We’ll choose a specific time, say the Late Cambrian Period, about 514 million years ago The image below is a reconstruction of the paleogeography at that time according to Chris Scotese. Scotese is based in Texas and through various means (e.g., paleomagnetism), he has produced the most widely accepted paleogeographic maps for the Phanerozoic Era. He also produced a flip book showing the drift of the continents over this period of time which is available for purchase from his website. I have one if you want to see what it is like before you buy. GY 112 Lecture Notes D. Haywick (2006) 2 From Scotese C.R., 1995. Phanerozoic plate tectonic reconstructions, PALEOMAP Progress Report 336, Department of Geology, University of Texas at Arlington (http://www.scotese.com/newpage12.htm) Let’s concentrate on North America. The sketch below is derived from Scotese’s paleogeographic map. Note that at this time, North America was tilted almost 90 degrees GY 112 Lecture Notes D. Haywick (2006) 3 relative to what it is today, there was a seaway running down through the western Provinces and States and the equator ran right through the heart of the continent. At this time, tropical reefs lined shallow marine intervals of the not-yet-formed Appalachian Mountains (really! I studied some of these reef complexes as part of my Masters study in Newfoundland). Assume for the moment that Hudson’s Bay (in central Canada) was around back in the Late Cambrian (it wasn’t at least not in the form it is today). Since our fantasy bay would have straddled the equator, it is a good bet that tropical reefs would have occurred in the shallow marine portions (just like I found in Newfoundland). The shoreline itself may have been lined in a beach (quartz arenite sand). Inland, lay the terrestrial rocks that comprised the North American continent. These are the crystalline rocks of what we today call the Canadian Shield (mostly granite). Even 514 million years ago, the continent was old (about 2 billion years old near Hudson Bay). Seaward of the reef, the water depths should have increased possibly to 100 metres or more. The following cartoon summarizes what the distribution of these various rocks and depositional environments might have looked like 514 million years ago in our fantasy reconstruction: Now let’s come forward in time. It is the present and you are a geologist working with the Geological Survey of Canada (one of the World’s most respected geological organizations). You are up near Hudson’s Bay studying Late Cambrian sedimentary rocks (bring your blankets and bug repellent. Up here you either freeze [winter] or get eaten alive by mosquitoes, black flies, noseeums, deer flies and horse flies [the remaining 3 months of the year]). If you measured sections at 4 locations (shown on the map) you might encounter the following successions of sedimentary rocks. I’ve drawn them up as stratigraphic sections: GY 112 Lecture Notes D. Haywick (2006) 4 In this situation, you could simply correlate the rock units on the basis of their lithology (i.e., lithostratigraphic correlations). But if you are interested in paleogeography, you also need to correlate the rocks according to time (i.e., chronostratigraphy). You must determine facies changes. They are what allow you to derive paleogeographic maps. Here is how the environments match up between the 4 sections: GY 112 Lecture Notes D. Haywick (2006) 5 For this class, it was necessary to do this example backwards so you could see how everything fits together, but if you were doing this for real, you would start with studying the rocks in the outcrops they are presently exposed in (e.g., establishing their ages, paleoenvironments of deposition, lateral facies changes etc.). Then you would plot these data on a map, rotate the map relative to the latitude and longitude at the time of deposition (paleomagnetism would help here) and correlate the various environments of deposition from one section to the next. The next thing you know, you have a genuine paleogeographic map. This one of the Permian when Pangaea was around comes to you via the Paleogeography Atlas Project (University of Chicago). Ziegler, A.M., M.L. Hulver, and D.B. Rowley, 1997. Permian world topography and climate. In: Late Glacial and Post-Glacial Environmental Changes - Quaternary, Carboniferous-Permian and Proterozoic, I.P. Martini (ed.), pp. 111-146., New York: Oxford University Press. GY 112 Lecture Notes D. Haywick (2006) 6 C) Paleoclimate We have already discussed the importance of some fossils in determining paleoclimate. Corals are mostly tropical, so if you find a bunch of corals in the rock record, it usually means that you are dealing with a tropical situation. Here are a couple of other less blatantly obvious examples. 1) My paleo-colleague Dr Clark is a micropaleontologist. She studies microfossils. Some of the beasties that she examines are foraminifera and she has noticed that their sizes vary at different geological times. She has concluded that the size variation is due to food availability and water temperature. So you can determine water temperature (a variant of climate) by looking at the size range of these microbeasties. 2) I also encountered a “cold water” indicator in my work in New Zealand. There is a scallop shell (Chlamys delicatula) that today only occurs in sub-Antarctica waters (it is a cold water beastie). But you periodically find it within Tertiary-aged sedimentary rocks in eastern New Zealand. The rocks you find it in were deposited during sea level lowstands which corresponds to glacial periods. When the ice melted (interglacials), the climate warmed up and Chlamys delicatula retreated back toward the pole. Now this may seem to be a blatantly predictable exercise, but this type of paleoclimatic interpretation works for much older rocks as well. By using similar cold water indicators, glaciations have been identified in Australia (Permian) and possibly Africa (Ordovician). Important terms/concepts from today’s lecture (Google any terms that you are not familiar with) Paleogeography Paleogeographic maps Seaway Canadian Shield Paleoclimate Micropaleontology
