Table1: Summary Statistics
advertisement
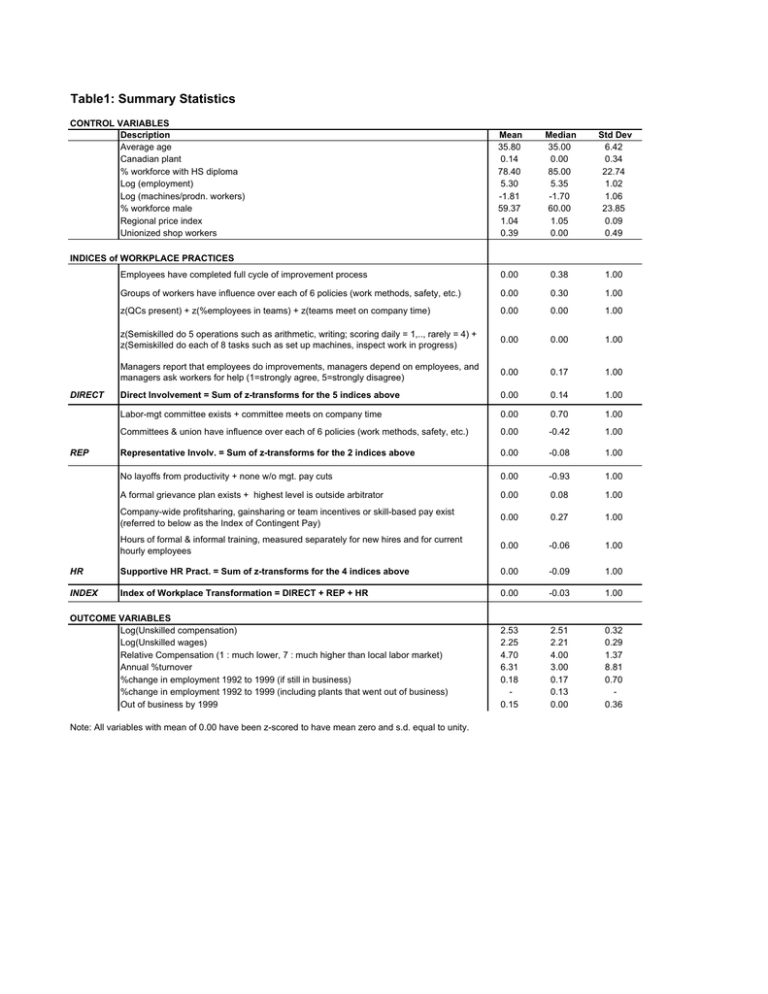
Table1: Summary Statistics CONTROL VARIABLES Description Average age Canadian plant % workforce with HS diploma Log (employment) Log (machines/prodn. workers) % workforce male Regional price index Unionized shop workers Mean 35.80 0.14 78.40 5.30 -1.81 59.37 1.04 0.39 Median 35.00 0.00 85.00 5.35 -1.70 60.00 1.05 0.00 Std Dev 6.42 0.34 22.74 1.02 1.06 23.85 0.09 0.49 Employees have completed full cycle of improvement process 0.00 0.38 1.00 Groups of workers have influence over each of 6 policies (work methods, safety, etc.) 0.00 0.30 1.00 z(QCs present) + z(%employees in teams) + z(teams meet on company time) 0.00 0.00 1.00 z(Semiskilled do 5 operations such as arithmetic, writing; scoring daily = 1,.., rarely = 4) + z(Semiskilled do each of 8 tasks such as set up machines, inspect work in progress) 0.00 0.00 1.00 Managers report that employees do improvements, managers depend on employees, and managers ask workers for help (1=strongly agree, 5=strongly disagree) 0.00 0.17 1.00 Direct Involvement = Sum of z-transforms for the 5 indices above 0.00 0.14 1.00 INDICES of WORKPLACE PRACTICES DIRECT Labor-mgt committee exists + committee meets on company time 0.00 0.70 1.00 Committees & union have influence over each of 6 policies (work methods, safety, etc.) 0.00 -0.42 1.00 Representative Involv. = Sum of z-transforms for the 2 indices above 0.00 -0.08 1.00 No layoffs from productivity + none w/o mgt. pay cuts 0.00 -0.93 1.00 A formal grievance plan exists + highest level is outside arbitrator 0.00 0.08 1.00 Company-wide profitsharing, gainsharing or team incentives or skill-based pay exist (referred to below as the Index of Contingent Pay) 0.00 0.27 1.00 Hours of formal & informal training, measured separately for new hires and for current hourly employees 0.00 -0.06 1.00 HR Supportive HR Pract. = Sum of z-transforms for the 4 indices above 0.00 -0.09 1.00 INDEX Index of Workplace Transformation = DIRECT + REP + HR 0.00 -0.03 1.00 2.53 2.25 4.70 6.31 0.18 0.15 2.51 2.21 4.00 3.00 0.17 0.13 0.00 0.32 0.29 1.37 8.81 0.70 0.36 REP OUTCOME VARIABLES Log(Unskilled compensation) Log(Unskilled wages) Relative Compensation (1 : much lower, 7 : much higher than local labor market) Annual %turnover %change in employment 1992 to 1999 (if still in business) %change in employment 1992 to 1999 (including plants that went out of business) Out of business by 1999 Note: All variables with mean of 0.00 have been z-scored to have mean zero and s.d. equal to unity.


![[#EXASOL-1429] Possible error when inserting data into large tables](http://s3.studylib.net/store/data/005854961_1-9d34d5b0b79b862c601023238967ddff-300x300.png)
