Enrollment, Fall 200 6: By School, Gender, and Full- and Part-Time Students 31
advertisement

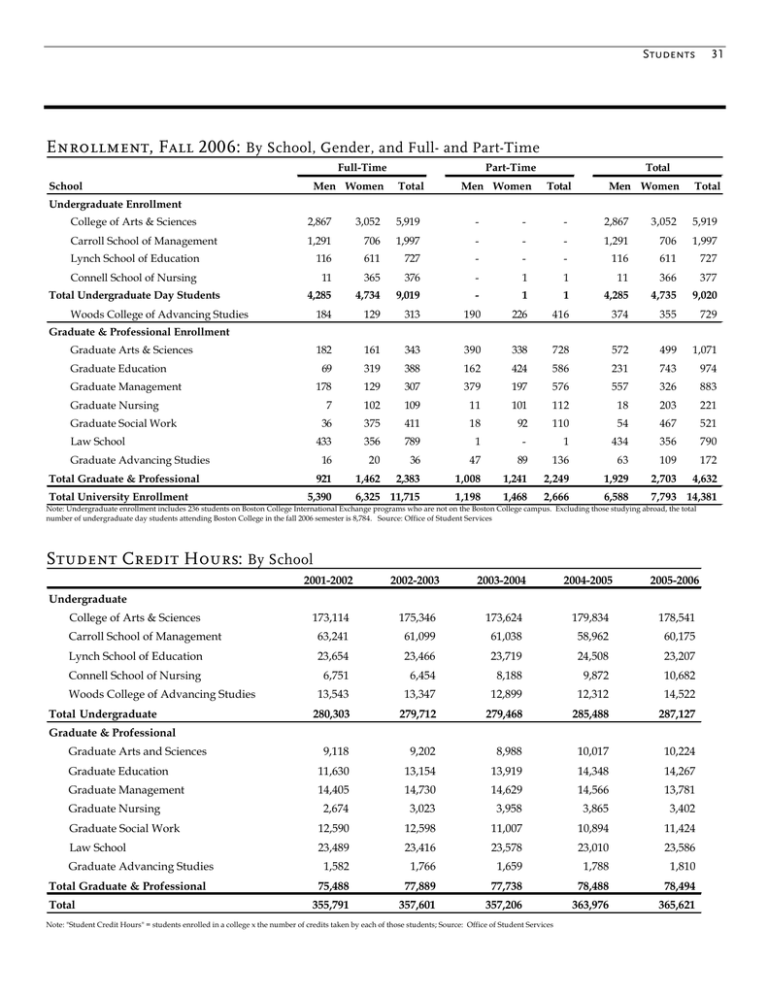
Students 31 Enrollment, Fall 2006: By School, Gender, and Full- and Part-Time Full-Time School Men Women Part-Time Total Men Women Total Total Men Women Total Undergraduate Enrollment College of Arts & Sciences 2,867 3,052 5,919 - - - 2,867 3,052 5,919 Carroll School of Management 1,291 706 1,997 - - - 1,291 706 1,997 116 611 727 - - - 116 611 727 Lynch School of Education Connell School of Nursing Total Undergraduate Day Students 11 365 376 - 1 1 11 366 377 4,285 4,734 9,019 - 1 1 4,285 4,735 9,020 184 129 313 190 226 416 374 355 729 182 161 343 390 338 728 572 499 1,071 Woods College of Advancing Studies Graduate & Professional Enrollment Graduate Arts & Sciences Graduate Education Graduate Management Graduate Nursing Graduate Social Work Law School Graduate Advancing Studies Total Graduate & Professional Total University Enrollment 69 319 388 162 424 586 231 743 974 178 129 307 379 197 576 557 326 883 7 102 109 11 101 112 18 203 221 36 375 411 18 92 110 54 467 521 433 356 789 1 - 1 434 356 790 16 20 36 47 89 136 63 109 172 1,462 2,383 1,008 1,241 2,249 1,929 2,703 4,632 6,325 11,715 1,198 1,468 2,666 6,588 7,793 14,381 921 5,390 Note: Undergraduate enrollment includes 236 students on Boston College International Exchange programs who are not on the Boston College campus. Excluding those studying abroad, the total number of undergraduate day students attending Boston College in the fall 2006 semester is 8,784. Source: Office of Student Services Student Credit Hours: By School 2001-2002 2002-2003 2003-2004 2004-2005 2005-2006 173,114 175,346 173,624 179,834 178,541 Carroll School of Management 63,241 61,099 61,038 58,962 60,175 Lynch School of Education 23,654 23,466 23,719 24,508 23,207 Connell School of Nursing 6,751 6,454 8,188 9,872 10,682 13,543 13,347 12,899 12,312 14,522 280,303 279,712 279,468 285,488 287,127 9,118 9,202 8,988 10,017 10,224 Graduate Education 11,630 13,154 13,919 14,348 14,267 Graduate Management 14,405 14,730 14,629 14,566 13,781 2,674 3,023 3,958 3,865 3,402 Graduate Social Work 12,590 12,598 11,007 10,894 11,424 Law School 23,489 23,416 23,578 23,010 23,586 1,582 1,766 1,659 1,788 1,810 75,488 77,889 77,738 78,488 78,494 355,791 357,601 357,206 363,976 365,621 Undergraduate College of Arts & Sciences Woods College of Advancing Studies Total Undergraduate Graduate & Professional Graduate Arts and Sciences Graduate Nursing Graduate Advancing Studies Total Graduate & Professional Total Note: "Student Credit Hours" = students enrolled in a college x the number of credits taken by each of those students; Source: Office of Student Services


