Math 3070 § 1. Pump Price Example: Bootstrap Means are Name: Example
advertisement
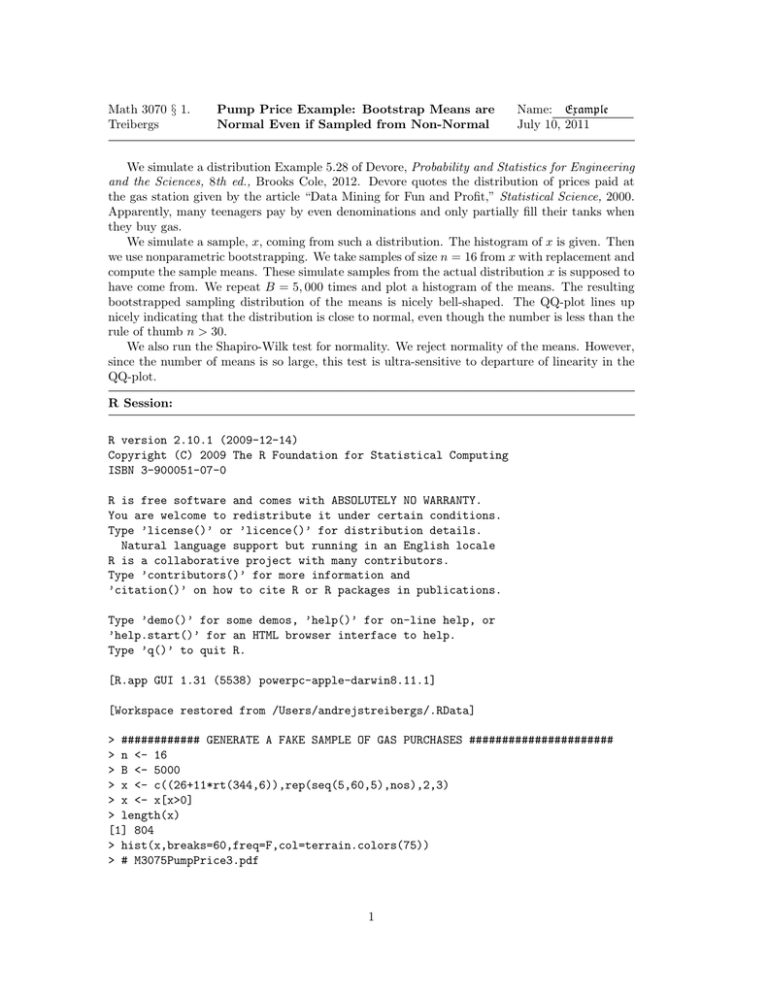
Math 3070 § 1. Treibergs Pump Price Example: Bootstrap Means are Normal Even if Sampled from Non-Normal Name: Example July 10, 2011 We simulate a distribution Example 5.28 of Devore, Probability and Statistics for Engineering and the Sciences, 8th ed., Brooks Cole, 2012. Devore quotes the distribution of prices paid at the gas station given by the article “Data Mining for Fun and Profit,” Statistical Science, 2000. Apparently, many teenagers pay by even denominations and only partially fill their tanks when they buy gas. We simulate a sample, x, coming from such a distribution. The histogram of x is given. Then we use nonparametric bootstrapping. We take samples of size n = 16 from x with replacement and compute the sample means. These simulate samples from the actual distribution x is supposed to have come from. We repeat B = 5, 000 times and plot a histogram of the means. The resulting bootstrapped sampling distribution of the means is nicely bell-shaped. The QQ-plot lines up nicely indicating that the distribution is close to normal, even though the number is less than the rule of thumb n > 30. We also run the Shapiro-Wilk test for normality. We reject normality of the means. However, since the number of means is so large, this test is ultra-sensitive to departure of linearity in the QQ-plot. R Session: R version 2.10.1 (2009-12-14) Copyright (C) 2009 The R Foundation for Statistical Computing ISBN 3-900051-07-0 R is free software and comes with ABSOLUTELY NO WARRANTY. You are welcome to redistribute it under certain conditions. Type ’license()’ or ’licence()’ for distribution details. Natural language support but running in an English locale R is a collaborative project with many contributors. Type ’contributors()’ for more information and ’citation()’ on how to cite R or R packages in publications. Type ’demo()’ for some demos, ’help()’ for on-line help, or ’help.start()’ for an HTML browser interface to help. Type ’q()’ to quit R. [R.app GUI 1.31 (5538) powerpc-apple-darwin8.11.1] [Workspace restored from /Users/andrejstreibergs/.RData] > ############ GENERATE A FAKE SAMPLE OF GAS PURCHASES ###################### > n <- 16 > B <- 5000 > x <- c((26+11*rt(344,6)),rep(seq(5,60,5),nos),2,3) > x <- x[x>0] > length(x) [1] 804 > hist(x,breaks=60,freq=F,col=terrain.colors(75)) > # M3075PumpPrice3.pdf 1 > ################ BOOTSRAPPING SAMPLE FROM x OF SIZE > y <-replicate(B,mean(sample(x,n,replace=T))) > > summary(y) Min. 1st Qu. Median Mean 3rd Qu. Max. 16.68 24.86 27.14 27.19 29.45 39.92 > sd(y) [1] 3.370162 > + > > > > > > > > > n=16 ################ hist(y, freq = F, col=topo.colors(25), xlab = "Mean", breaks = 25, main = paste("Approx Samp Dist of Mean, samp.size=", n, " reps=", B)) # M3075PumpPrice1.pdf ################ MAKE QQ-PLOT OF BOOTSTRAPPED MEANS ######################### qqnorm(y) qqline(y,col=2) # M3075PumpPrice2.pdf ################# SHAPITO-WILK TEST ON BOOTSTRAPPED SAMPLES ################# shapiro.test(y) Shapiro-Wilk normality test data: y W = 0.9989, p-value = 0.001549 2 0.00 0.02 0.04 0.06 Density 0.08 0.10 0.12 Histogram of x 0 10 20 30 3 40 x 50 60 70 0.06 0.04 0.02 0.00 Density 0.08 0.10 0.12 Approx Samp Dist of Mean, samp.size= 16 reps= 5000 20 25 30 Mean 4 35 40 30 25 20 Sample Quantiles 35 40 Normal Q-Q Plot -4 -2 0 Theoretical Quantiles 5 2 4
