Math 3070 § 1. Particulate Data: Name: Example
advertisement
Math 3070 § 1.
Treibergs
Particulate Data:
Sample Statistics and Boxplots.
Name:
Example
September 4, 2010
Data File Used in this Analysis:
# Math 3070 - 1
Particulate Data
Treibergs
#
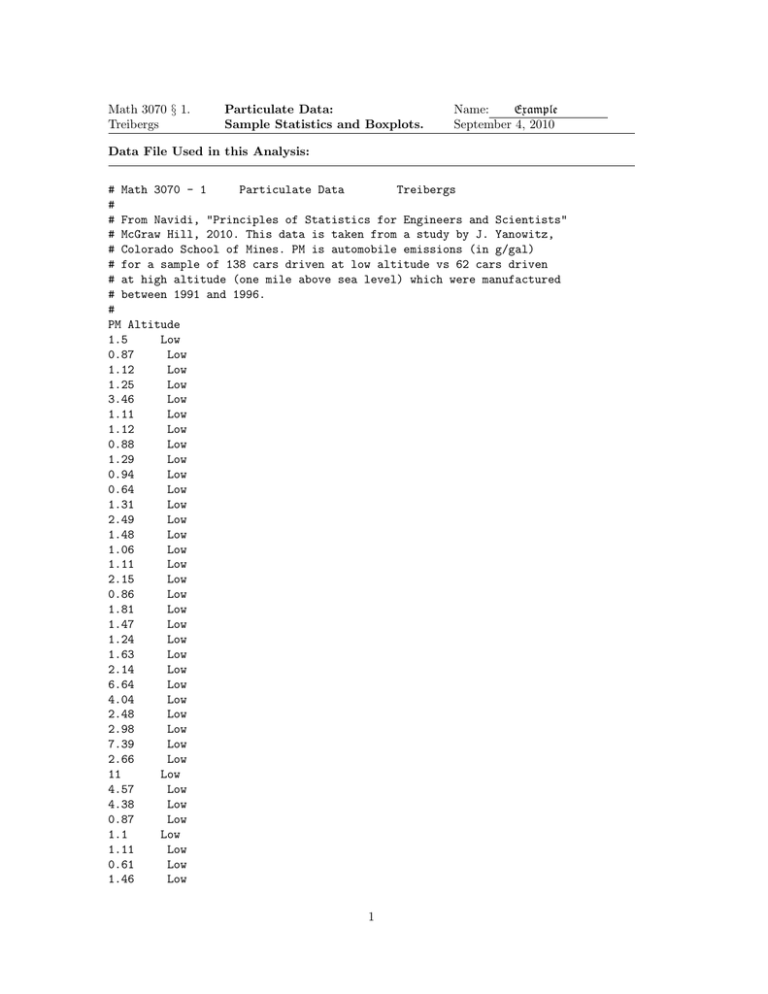
# From Navidi, "Principles of Statistics for Engineers and Scientists"
# McGraw Hill, 2010. This data is taken from a study by J. Yanowitz,
# Colorado School of Mines. PM is automobile emissions (in g/gal)
# for a sample of 138 cars driven at low altitude vs 62 cars driven
# at high altitude (one mile above sea level) which were manufactured
# between 1991 and 1996.
#
PM Altitude
1.5
Low
0.87
Low
1.12
Low
1.25
Low
3.46
Low
1.11
Low
1.12
Low
0.88
Low
1.29
Low
0.94
Low
0.64
Low
1.31
Low
2.49
Low
1.48
Low
1.06
Low
1.11
Low
2.15
Low
0.86
Low
1.81
Low
1.47
Low
1.24
Low
1.63
Low
2.14
Low
6.64
Low
4.04
Low
2.48
Low
2.98
Low
7.39
Low
2.66
Low
11
Low
4.57
Low
4.38
Low
0.87
Low
1.1
Low
1.11
Low
0.61
Low
1.46
Low
1
0.97
0.9
1.4
1.37
1.81
1.14
1.63
3.67
0.55
2.67
2.63
3.03
1.23
1.04
1.63
3.12
2.37
2.12
2.68
1.17
3.34
3.79
1.28
2.1
6.55
1.18
3.06
0.48
0.25
0.53
3.36
3.47
2.74
1.88
5.94
4.24
3.52
3.59
3.1
3.33
4.58
6.73
7.82
4.59
5.12
5.67
4.07
4.01
2.72
3.24
5.79
3.59
Low
Low
Low
Low
Low
Low
Low
Low
Low
Low
Low
Low
Low
Low
Low
Low
Low
Low
Low
Low
Low
Low
Low
Low
Low
Low
Low
Low
Low
Low
Low
Low
Low
Low
Low
Low
Low
Low
Low
Low
Low
Low
Low
Low
Low
Low
Low
Low
Low
Low
Low
Low
2
3.48
2.96
5.3
3.93
3.52
2.96
3.12
1.07
5.3
5.16
7.74
5.41
3.4
4.97
11.23
9.3
6.5
4.62
5.45
4.93
6.05
5.82
10.19
3.62
2.67
2.75
8.92
9.93
6.96
5.78
9.14
10.63
8.23
6.83
5.6
5.41
6.7
5.93
4.51
9.04
7.71
7.21
4.67
4.49
4.63
2.8
2.16
2.97
3.9
7.59
6.28
6.07
Low
Low
Low
Low
Low
Low
Low
Low
Low
Low
Low
Low
Low
Low
Low
Low
Low
Low
Low
Low
Low
Low
Low
Low
Low
Low
Low
Low
Low
Low
Low
Low
Low
Low
Low
Low
Low
Low
Low
Low
Low
Low
Low
Low
Low
Low
Low
Low
Low
High
High
High
3
5.23
5.54
3.46
2.44
3.01
13.63
13.02
23.38
9.24
3.22
2.06
4.04
17.11
12.26
19.91
8.5
7.81
7.18
6.95
18.64
7.1
6.04
5.66
8.86
4.4
3.57
4.35
3.84
2.37
3.81
5.32
5.84
2.89
4.68
1.85
9.14
8.67
9.52
2.68
10.14
9.2
7.31
2.09
6.32
6.53
6.32
2.01
5.91
5.6
5.61
1.5
6.46
High
High
High
High
High
High
High
High
High
High
High
High
High
High
High
High
High
High
High
High
High
High
High
High
High
High
High
High
High
High
High
High
High
High
High
High
High
High
High
High
High
High
High
High
High
High
High
High
High
High
High
High
4
5.29
5.64
2.07
1.11
3.32
1.83
7.56
High
High
High
High
High
High
High
R Session:
R version 2.10.1 (2009-12-14)
Copyright (C) 2009 The R Foundation for Statistical Computing
ISBN 3-900051-07-0
R is free software and comes with ABSOLUTELY NO WARRANTY.
You are welcome to redistribute it under certain conditions.
Type ’license()’ or ’licence()’ for distribution details.
Natural language support but running in an English locale
R is a collaborative project with many contributors.
Type ’contributors()’ for more information and
’citation()’ on how to cite R or R packages in publications.
Type ’demo()’ for some demos, ’help()’ for on-line help, or
’help.start()’ for an HTML browser interface to help.
Type ’q()’ to quit R.
[R.app GUI 1.31 (5537) powerpc-apple-darwin9.8.0]
> tt <- read.table("M3073ParticleData.txt",header=TRUE)
Error in file(file, "rt") : cannot open the connection
In addition: Warning message:
In file(file, "rt") :
cannot open file ’M3073ParticleData.txt’: No such file or directory
> tt <- read.table("M3070ParticulateData.txt",header=TRUE)
> tt
PM Altitude
1
1.50
Low
2
0.87
Low
3
1.12
Low
4
1.25
Low
5
3.46
Low
6
1.11
Low
7
1.12
Low
8
0.88
Low
9
1.29
Low
10
0.94
Low
11
0.64
Low
12
1.31
Low
13
2.49
Low
5
14
15
16
17
18
19
20
21
22
23
24
25
26
27
28
29
30
31
32
33
34
35
36
37
38
39
40
41
42
43
44
45
46
47
48
49
50
51
52
53
54
55
56
57
58
59
60
61
62
63
64
65
1.48
1.06
1.11
2.15
0.86
1.81
1.47
1.24
1.63
2.14
6.64
4.04
2.48
2.98
7.39
2.66
11.00
4.57
4.38
0.87
1.10
1.11
0.61
1.46
0.97
0.90
1.40
1.37
1.81
1.14
1.63
3.67
0.55
2.67
2.63
3.03
1.23
1.04
1.63
3.12
2.37
2.12
2.68
1.17
3.34
3.79
1.28
2.10
6.55
1.18
3.06
0.48
Low
Low
Low
Low
Low
Low
Low
Low
Low
Low
Low
Low
Low
Low
Low
Low
Low
Low
Low
Low
Low
Low
Low
Low
Low
Low
Low
Low
Low
Low
Low
Low
Low
Low
Low
Low
Low
Low
Low
Low
Low
Low
Low
Low
Low
Low
Low
Low
Low
Low
Low
Low
6
66
0.25
67
0.53
68
3.36
69
3.47
70
2.74
71
1.88
72
5.94
73
4.24
74
3.52
75
3.59
76
3.10
77
3.33
78
4.58
79
6.73
80
7.82
81
4.59
82
5.12
83
5.67
84
4.07
85
4.01
86
2.72
87
3.24
88
5.79
89
3.59
90
3.48
91
2.96
92
5.30
93
3.93
94
3.52
95
2.96
96
3.12
97
1.07
98
5.30
99
5.16
100 7.74
101 5.41
102 3.40
103 4.97
104 11.23
105 9.30
106 6.50
107 4.62
108 5.45
109 4.93
110 6.05
111 5.82
112 10.19
113 3.62
114 2.67
115 2.75
116 8.92
117 9.93
Low
Low
Low
Low
Low
Low
Low
Low
Low
Low
Low
Low
Low
Low
Low
Low
Low
Low
Low
Low
Low
Low
Low
Low
Low
Low
Low
Low
Low
Low
Low
Low
Low
Low
Low
Low
Low
Low
Low
Low
Low
Low
Low
Low
Low
Low
Low
Low
Low
Low
Low
Low
7
118
119
120
121
122
123
124
125
126
127
128
129
130
131
132
133
134
135
136
137
138
139
140
141
142
143
144
145
146
147
148
149
150
151
152
153
154
155
156
157
158
159
160
161
162
163
164
165
166
167
168
169
6.96
5.78
9.14
10.63
8.23
6.83
5.60
5.41
6.70
5.93
4.51
9.04
7.71
7.21
4.67
4.49
4.63
2.80
2.16
2.97
3.90
7.59
6.28
6.07
5.23
5.54
3.46
2.44
3.01
13.63
13.02
23.38
9.24
3.22
2.06
4.04
17.11
12.26
19.91
8.50
7.81
7.18
6.95
18.64
7.10
6.04
5.66
8.86
4.40
3.57
4.35
3.84
Low
Low
Low
Low
Low
Low
Low
Low
Low
Low
Low
Low
Low
Low
Low
Low
Low
Low
Low
Low
Low
High
High
High
High
High
High
High
High
High
High
High
High
High
High
High
High
High
High
High
High
High
High
High
High
High
High
High
High
High
High
High
8
170 2.37
High
171 3.81
High
172 5.32
High
173 5.84
High
174 2.89
High
175 4.68
High
176 1.85
High
177 9.14
High
178 8.67
High
179 9.52
High
180 2.68
High
181 10.14
High
182 9.20
High
183 7.31
High
184 2.09
High
185 6.32
High
186 6.53
High
187 6.32
High
188 2.01
High
189 5.91
High
190 5.60
High
191 5.61
High
192 1.50
High
193 6.46
High
194 5.29
High
195 5.64
High
196 2.07
High
197 1.11
High
198 3.32
High
199 1.83
High
200 7.56
High
> attach(tt)
> # The second variable is a "factor" that determines whether the
> $ observation is from "Low" or "High" altitude.
> Alt <- factor(Altitude)
> # The plot of a single variable for each factor level generates a
> # boxplot. Otherwise, use the instruction boxplot.
> plot(PM ~ Alt,ylab="Auto Emissions Particulate Matter (g/gal)",
xlab="Altitude", main="Auto Emissions at Different Altitudes")
> # We make the dotplots of the two emissions data sets.
> layout(matrix(1:2,ncol=1))
> stripchart(round(PM,1) ~ Alt, method="stack", at=c(1.5,2), col=c(2,4),
cex=.5, pch=19:20,xlab="Emission Particulate Matter (g/gal)")
>
9
> # The read.table produces a data-frame. Summary produces min/max,
> # quartiles and mean for variable in the frame.
> summary(tt)
PM
Altitude
Min.
: 0.250
High: 62
1st Qu.: 2.085
Low :138
Median : 3.730
Mean
: 4.608
3rd Qu.: 6.055
Max.
:23.380
> # The summary applied to a single vector produces the six numbers for it.
> # tapply separates the vector PM according to levels of the factor Alt
> tapply(PM, Alt, summary)
$High
Min. 1st Qu. Median
Mean 3rd Qu.
Max.
1.110
3.488
5.750
6.596
7.755 23.380
$Low
Min. 1st Qu.
0.250
1.473
Median
3.180
Mean 3rd Qu.
3.715
5.265
Max.
11.230
> # here i define the function allstat. For the vector x it makes a little
> # table with n, mean, sd and var including labels.
> allstat <- function(x){matrix(c(length(x),mean(x),sd(x),var(x)), ncol=4,
dimnames=list("",
c("n"," Sample Mean"," Sample Std. Dev."," Sample Variance")))}
> tapply(PM,Alt,allstat)
$High
n
Sample Mean
Sample Std. Dev.
Sample Variance
62
6.596452
4.518998
20.42134
$Low
n
138
>
>
>
>
Sample Mean
3.714565
Sample Std. Dev.
2.55804
Sample Variance
6.54357
# Finally, we print the two dotplots on the same horizontal scale
xr <- range(PM)*c(0.9,1.1)
layout(matrix(1:2,ncol=1))
stripchart(round(PM,1) ~ Alt, method="stack", at=c(1.5,2), col=c(2,4),
cex=.5, pch=19:20, xlab="Emission Particulate Matter (g/gal)")
10
11
12
