More on the paired t-test in Stata:
Suppose I was interested in performing a paired t-test in Stata, but wanted to input the
raw data into Stata and have the program do all my computations.
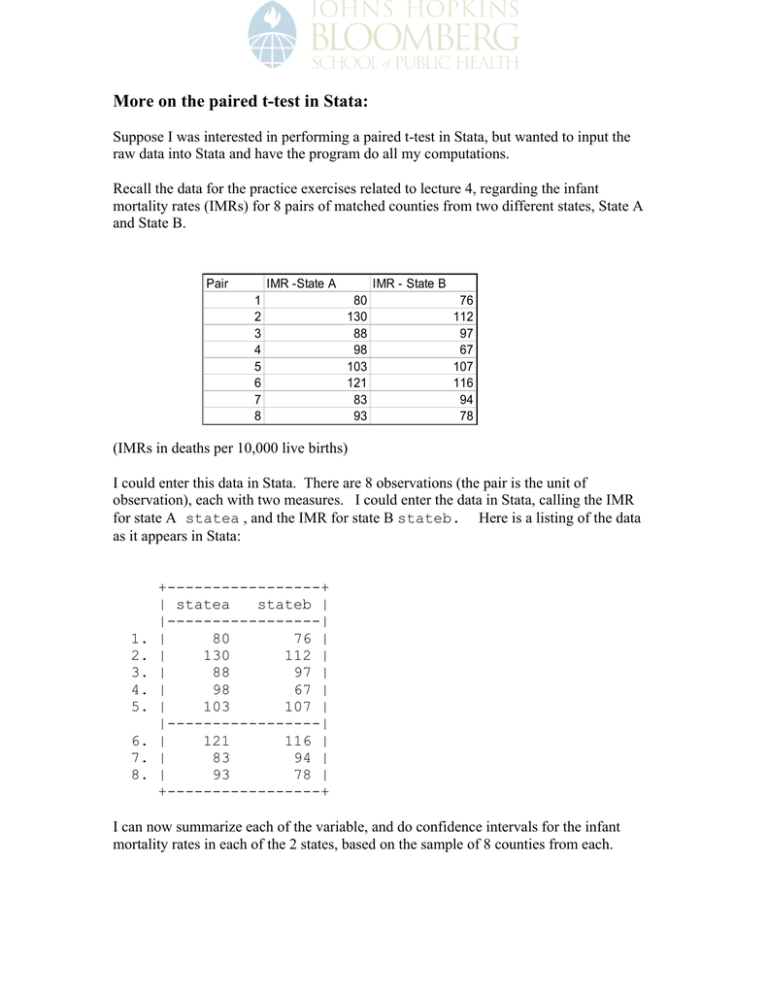
Recall the data for the practice exercises related to lecture 4, regarding the infant
mortality rates (IMRs) for 8 pairs of matched counties from two different states, State A
and State B.
Pair
IMR -State A
1
2
3
4
5
6
7
8
IMR - State B
80
130
88
98
103
121
83
93
76
112
97
67
107
116
94
78
(IMRs in deaths per 10,000 live births)
I could enter this data in Stata. There are 8 observations (the pair is the unit of
observation), each with two measures. I could enter the data in Stata, calling the IMR
for state A statea , and the IMR for state B stateb. Here is a listing of the data
as it appears in Stata:
1.
2.
3.
4.
5.
6.
7.
8.
+-----------------+
| statea
stateb |
|-----------------|
|
80
76 |
|
130
112 |
|
88
97 |
|
98
67 |
|
103
107 |
|-----------------|
|
121
116 |
|
83
94 |
|
93
78 |
+-----------------+
I can now summarize each of the variable, and do confidence intervals for the infant
mortality rates in each of the 2 states, based on the sample of 8 counties from each.
To get the mean and standard deviation for each measure, use the summarize
command:
. summarize
statea stateb
Variable |
Obs
Mean
Std. Dev.
Min
Max
-------------+-------------------------------------------------------statea |
8
99.5
17.86457
80
130
stateb |
8
93.375
18.09449
67
116
To get 95% CIs for each measure, use the ci command (notice the lack of the extra “i” –
not needed when data is already in Stata so you are not providing summary statistics):
. ci statea stateb
Variable |
Obs
Mean
Std. Err.
[95% Conf. Interval]
-------------+--------------------------------------------------------------statea |
8
99.5
6.316079
84.56485
114.4352
stateb |
8
93.375
6.39737
78.24762
108.5024
Now to perform the paired t-test, you have two options:
1. Use the data as given and use the ttest command
Notice: ttest statea = stateb is testing that the mean of the variable
statea is equal to the mean of the variable stateb (ie: the mean difference is 0).
. ttest statea= stateb
Paired t test
-----------------------------------------------------------------------------Variable |
Obs
Mean
Std. Err.
Std. Dev.
[95% Conf. Interval]
---------+-------------------------------------------------------------------statea |
8
99.5
6.316079
17.86457
84.56485
114.4352
stateb |
8
93.375
6.39737
18.09449
78.24762
108.5024
---------+-------------------------------------------------------------------diff |
8
6.125
5.121514
14.48583
-5.985457
18.23546
-----------------------------------------------------------------------------Ho: mean(statea - stateb) = mean(diff) = 0
Ha: mean(diff) < 0
t =
1.1959
P < t =
0.8647
Ha: mean(diff) != 0
t =
1.1959
P > |t| =
0.2707
Ha: mean(diff) > 0
t =
1.1959
P > t =
0.1353
If you want to have some fun, try the above but instead type ttest stateb =
statea. How do the results differ – is the interpretation the same? (hint: it should
be)
2. First create a new variable that computes the difference in IMRs between each
county pair (I called this diff), and then use the ttest command.
. generate diff = statea-stateb
. ci diff
Variable |
Obs
Mean
Std. Err.
[95% Conf. Interval]
-------------+--------------------------------------------------------------diff |
8
6.125
5.121514
-5.985457
18.23546
. ttest
diff=0
One-sample t test
-----------------------------------------------------------------------------Variable |
Obs
Mean
Std. Err.
Std. Dev.
[95% Conf. Interval]
---------+-------------------------------------------------------------------diff |
8
6.125
5.121514
14.48583
-5.985457
18.23546
-----------------------------------------------------------------------------Degrees of freedom: 7
Ho: mean(diff) = 0
Ha: mean < 0
t =
1.1959
P < t =
0.8647
Ha: mean != 0
t =
1.1959
P > |t| =
0.2707
Ha: mean > 0
t =
1.1959
P > t =
0.1353
You can also play around with the formulation of the variable for the difference:
What would happen if instead you created diff to be stateb-statea ? How do
the results differ – is the interpretation the same? (hint: it should be)
Copyright 2005, The Johns Hopkins University and John McGready. All rights reserved. Use of these materials permitted only in accordance with license rights
granted. Materials provided “AS IS”; no representations or warranties provided. User assumes all responsibility for use, and all liability related thereto, and must
independently review all materials for accuracy and efficacy. May contain materials owned by others. User is responsible for obtaining permissions for use from
third parties as needed.

