Document 11244901
advertisement

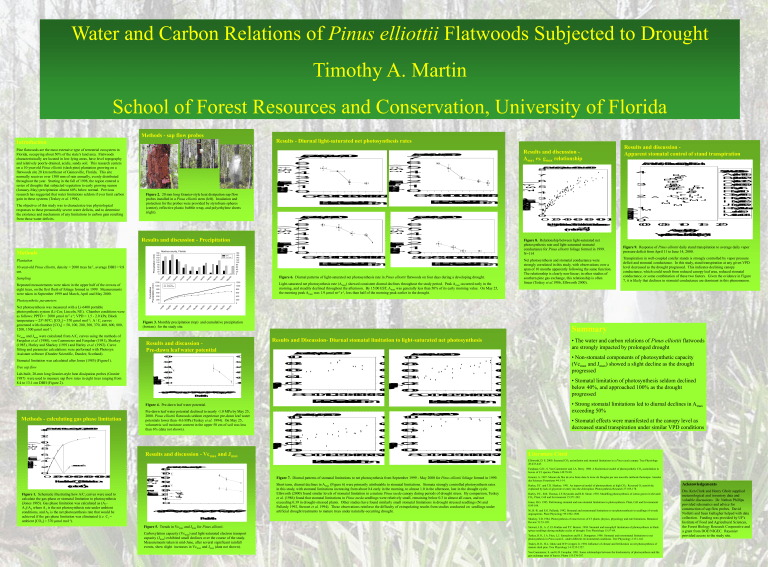
Water and Carbon Relations of Pinus elliottii Flatwoods Subjected to Drought Timothy A. Martin School of Forest Resources and Conservation, University of Florida Methods - sap flow probes Results - Diurnal light-saturated net photosynthesis rates LNetPhosyniRateight-Saur(uemdol -2s -1) ay / 1000 800 800 600 600 400 400 200 200 E a s t e r n S t a n d a r d T i m e E a s t e r n S t a n d a r d T i m e Light-saturated net photosynthesis rate (Amax) showed consistent diurnal declines throughout the study period. Peak Amax occurred early in the morning, and steadily declined throughout the afternoon. By 15:00 EST, Amax was generally less than 50% of its early morning value. On May 25, the morning peak Amax was 1.9 µmol m-2 s-1, less than half of the morning peak earlier in the drought. 0 . 4 Lab-built, 20-mm long Granier-style heat dissipation probes (Granier 1987) were used to measure sap flow rates in eight trees ranging from 8.4 to 13.1 cm DBH (Figure 2). 0 . 6 0 . 6 P i n u s e l l i o t t i i , M a r c h 9 , 2 0 0 0 1 . 0 1 . 0 1 . 0 1 . 0 0 . 8 0 . 8 0 . 8 0 . 8 0 . 6 0 . 6 0 . 6 0 . 6 0 . 4 0 . 4 0 . 4 0 . 4 1 . 0 1 . 0 0 . 2 0 . 2 0 . 2 0 . 2 Sep/9 Oct/9 Nov/9 Dec/9 Jan/0 Feb/0 Mar/0 Apr/0 May/0 Jun/0 WaterPontial(MP)re-DawnLef 0 . 8 E a s t e r n S t a n d a r d T i m e Pre-dawn leaf water potential declined to nearly -1.0 MPa by May 25, 2000. Pinus elliottii flatwoods seldom experience pre-dawn leaf water potentials lower than -0.6 MPa (Teskey et al. 1994). On May 25, volumetric soil moisture content in the upper 50 cm of soil was less than 6% (data not shown). P i n u s e l l i o t t i i , A p r i l 3 , 2 0 0 0 P i n u s e l l i o t t i i , M a y 2 5 , 2 0 0 0 1 . 0 0 . 8 . 8 0 . 8 0 0 . 8 0 . 6 . 6 0 . 6 0 0 . 6 1 2 0 . 4 . 4 0 . 4 0 0 . 4 1 0 0 . 2 . 2 0 . 2 0 0 . 2 StomalNLeiPhonstyi 8 Results and discussion - Vcmax and Jmax 4 . 0 0 . 0 0 . 0 0 . 0 0 8 9 1 0 1 1 1 2 1 3 1 4 1 5 1 6 1 7 8 9 1 0 1 1 1 2 1 3 1 4 1 5 1 6 1 7 E a s t e r n S t a n d a r d T i m e 1 3 7 0 u m o l m o l E a s t e r n S t a n d a r d T i m e P i n u s e l l i o t t i i , A l a c h u a C o u n t y , F L 1 . 5 2 . 0 A v e r a g e D a i l y V a p o r P r e s s u r e D e f i c i t ( k P a ) Figure 9. Response of Pinus elliottii daily stand transpiration to average daily vapor pressure deficit from April 11 to June 14, 2000. Transpiration in well-coupled conifer stands is strongly controlled by vapor pressure deficit and stomatal conductance. In this study, stand transpiration at any given VPD level decreased as the drought progressed. This indicates declining canopy conductance, which could result from reduced canopy leaf area, reduced stomatal conductance, or some combination of these two factors. Given the evidence in Figure 7, it is likely that declines in stomatal conductance are dominant in this phenomenon. 7 0 6 0 5 0 4 0 3 0 2 0 1 0 V c m a x J m a x Sep/9 Oct/9 Nov/9 Dec/9 Jan/0 Feb/0 Mar/0 Apr/0 May/0 Jun/0 0 M o n t h Figure 5. Trends in Vcmax and Jmax for Pinus elliottii. Carboxylation capacity (Vcmax) and light-saturated electron transport capacity (Jmax) exhibited small declines over the course of the study. Measurements taken in mid-June, after several significant rainfall events, show slight increases in Vcmax and Jmax (data not shown). • Stomatal limitation of photosynthesis seldom declined below 40%, and approached 100% as the drought progressed • Strong stomatal limitations led to diurnal declines in Amax exceeding 50% • Stomatal effects were manifested at the canopy level as decreased stand transpiration under similar VPD conditions Literature Cited Ellsworth, D. S. 2000. Seasonal CO2 assimilation and stomatal limitations in a Pinus taeda canopy. Tree Physiology 20:435-445. Farqhuar, G.D., S. Von Caemmerer and J.A. Berry. 1980. A biochemical model of photosynthetic CO2 assimilation in leaves of C3 species. Planta 149:78-90. 8 0 V(umcol max orJ -2 smax-1 ) NetPhosyntheisRate(umol -2 s -1 ) A 2 StomalNLeiPhonstyi . 0 1 . 0 1 Figure 1. Schematic illustrating how A/Ci curves were used to calculate the gas-phase or stomatal limitation to photosynthesis (Jones 1985). Gas phase limitation was calculated as (A2A1)/A2 where A1 is the net photosynthesis rate under ambient conditions, and A2 is the net photosynthesis rate that would be achieved if the gas phase limitation was eliminated (i.e. Ci = ambient [CO2] = 370 µmol mol-1). 1 . 0 • Non-stomatal components of photosynthetic capacity (Vcmax and Jmax) showed a slight decline as the drought progressed E a s t e r n S t a n d a r d T i m e 1 . 0 ( u m o l m o l) Net photosynthesis and stomatal conductance were strongly correlated in this study, with observations over a span of 10 months apparently following the same function. The relationship is clearly non-linear; in other studies of southern pine gas exchange, this relationship is often linear (Teskey et al.1986, Ellsworth 2000). 0 . 0 0 . 0 0 . 0 0 . 0 8 9 1 0 1 1 1 2 1 3 1 4 1 5 1 6 1 7 8 9 1 0 1 1 1 2 1 3 1 4 1 5 1 6 1 7 Figure 4. Pre-dawn leaf water potential. 1 Figure 8. Relationship between light-saturated net photosynthesis rate and light-saturated stomatal conductance for Pinus elliottii foliage formed in 1999. N=114 0 . 5 • The water and carbon relations of Pinus elliottii flatwoods are strongly impacted by prolonged drought 0 . 8 M o n t h I n t e r c e l l u l a r C O C o n c e n t r a t i o n 2 L i g h t S a t u r a t e d S t o m a t a l C o n d u c t a n c e 2 1 ( m m o l m s ) A 0 0 . 0 0 0 . 4 0 02 0 04 0 06 0 08 0 0 1 0 0 0 1 2 0 0 0 0 2 04 06 08 01 0 01 2 0 /0 Tree sap flow 2 1 M Summary P i n u s e l l i o t t i i , S e p t e m b e r 6 , 1 9 9 9 0 . 2 A 1 2 M ay Ap r/0 0 0 ar /0 M Fe b/ 00 00 Ja n/ 9 /9 D ec 9 /9 N ov 9 O ct /9 /9 9 Se p /9 9 Au g l/9 9 Ju Results and discussion Pre-dawn leaf water potential 0 . 2 6 2 3 Results and Discussion- Diurnal stomatal limitation to light-saturated net photosynthesis Stomatal limitation was calculated after Jones (1985) (Figure1). P i n u s e l l i o t t i i , A l a c h u a C o u n t y , F L , A p r i l 2 0 0 0 4 Figure 3. Monthly precipitation (top) and cumulative precipitation (bottom) for the study site. 0 . 0 1 4 3 5 BA C B B C E B C D A C D F E E C E H H E B F F I G G F G F I J J II J G A H G M J I L L M M 0 0 . 0 Methods - calculating gas phase limitation 6 DailyStndTraspiton(m) 7 6 5 4 3 2 1 0 5 6 7 8 9 1 0 1 1 1 2 1 3 1 4 1 5 1 6 1 7 StomalNLeiPhonstyi Vcmax and Jmax were calculated from A/Ci curves using the methods of Farquhar et al. (1980), von Caemmerer and Farquhar (1981), Sharkey (1985), Harley and Sharkey (1991) and Harley et al. (1992). Curve fitting and parameter calculations were performed with Photosyn Assistant software (Dundee Scientific, Dundee, Scotland). 7 6 5 4 3 2 1 0 6 7 8 9 1 0 1 1 1 2 1 3 1 4 1 5 1 6 1 7 P i n u s e l l i o t t i i , M a y 2 5 , 2 0 0 0 S y m b o lD a t e s A A p r i l 1 1 1 5 B A p r i l 1 6 2 0 C A p r i l 2 1 2 5 D A p r i l 2 6 3 0 E M a y 1 5 F M a y 6 1 0 G M a y 1 1 1 5 H M a y 1 6 2 0 I M a y 2 1 2 5 JM a y 2 6 3 0 K M a y 3 1 J u n e 4 L J u n e 5 9 M J u n e 1 0 1 4 4 7 Figure 6. Diurnal patterns of light-saturated net photosynthesis rate in Pinus elliottii flatwoods on four days during a developing drought. 1200 Study Data 16-year mean 1000 P i n u s e l l i o t t i i , S e p t e m b e r 1 9 9 9 J u n e 2 0 0 0 8 M 1200 0 Net photosynthesis was measured with a Li-6400 portable photosynthesis system (Li-Cor, Lincoln, NE). Chamber conditions were as follows: PPFD = 2000 µmol m-2 s-1; VPD = 1.5 - 2.0 kPa; Block temperature = 25º-30ºC; [CO2] = 370 µmol mol-1; A / Ci curves generated with chamber [CO2] = 50, 100, 200, 300, 370, 400, 600, 800, 1200, 1500 µmol mol-1; 180 160 140 120 100 80 60 40 20 0 00 0 Ap r/0 /0 0 b/ 0 Fe M ar 0 0 n/ 0 Ja 99 D ec / 99 N ov / /9 9 ct 9 O p/ 9 Se Au Ju Cumulative Precipitation (mm) Photosynthetic parameters 9 Study 16 yr mean l/9 Sampling Repeated measurements were taken in the upper half of the crowns of eight trees, on the first flush of foliage formed in 1999. Measurements were taken in September 1999 and March, April and May 2000. LNetPhosyniRateight-Saur(uemdol -2s -1) LNetPhosyniRateight-Saur(uemdol -2s -1) Alachua county, Florida 9 10-year-old Pinus elliottii, density = 2080 trees ha-1, average DBH = 9.8 cm. 180 160 140 120 100 80 60 40 20 0 g/ 9 Plantation Precipitation (mm) Methods E a s t e r n S t a n d a r d T i m e Results and discussion Apparent stomatal control of stand transpiration P i n u s e l l i o t t i i , A l a c h u a C o u n t y , F l o r i d a 1 P i n u s e l l i o t t i i , A p r i l 3 , 2 0 0 0 Results and discussion - Precipitation 7 6 5 4 3 2 1 0 6 7 8 9 1 0 1 1 1 2 1 3 1 4 1 5 1 6 1 7 E a s t e r n S t a n d a r d T i m e LNetPhosyniRateight-Saur(uemdol -2s -1) The objective of this study was to characterize tree physiological responses to these presumably severe water deficits, and to determine the existence and mechanism of any limitations to carbon gain resulting from those water deficits. P i n u s e l l i o t t i i , S e p t e m b e r 6 , 1 9 9 9 Figure 2. 20 mm long Granier-style heat dissipation sap flow probes installed in a Pinus elliottii stem (left). Insulation and protection for the probes were provided by styrofoam spheres (center), reflective plastic bubble wrap, and polyethylene sheets (right). Results and discussion Amax vs. gmax relationship P i n u s e l l i o t t i i , M a r c h 9 , 2 0 0 0 7 6 5 4 3 2 1 0 6 7 8 9 1 0 1 1 1 2 1 3 1 4 1 5 1 6 1 7 StomalNLeiPhtonsyei Pine flatwoods are the most extensive type of terrestrial ecosystem in Florida, occupying about 50% of the state’s land area. Flatwoods characteristically are located in low-lying areas, have level topography and relatively poorly-drained, acidic, sandy soil. This research centers on a 10-year-old Pinus elliottii (slash pine) plantation growing on a flatwoods site 20 km northeast of Gainesville, Florida. This site normally receives over 1300 mm of rain annually, evenly distributed throughout the year. Starting in the fall of 1998, the region entered a series of droughts that subjected vegetation to early growing season (January-May) precipitation almost 60% below normal. Previous research has suggested that water limitations seldom if ever limit carbon gain in these systems (Teskey et al. 1994). NetPhosyntheisRateLig(uhmt-Soalurted -2 s -1 ) Introduction Figure 7. Diurnal patterns of stomatal limitations to net photosynthesis from September 1999 - May 2000 for Pinus elliottii foliage formed in 1999. Granier, A. 1987. Mesure du flux de sève brute dans le tronc du Douglas par une nouvelle méthode thermique. Annales des Sciences Forestieres 44:1-14. Short term, diurnal declines in Amax (Figure 6) were primarily attributable to stomatal limitations. Stomata strongly controlled photosynthesis rates in this study, with stomatal limitations increasing from about 0.4 early in the morning, to almost 1.0 in the afternoon, late in the drought cycle. Ellsworth (2000) found similar levels of stomatal limitation in a mature Pinus taeda canopy during periods of drought stress. By comparison, Teskey et al. (1986) found that stomatal limitations in Pinus taeda seedlings were relatively small, remaining below 0.3 in almost all cases, and not exceeding 0.39 in drought-stressed plants. Other studies have found similarly small stomatal limitations in drought stressed seedlings (Ni and Pallardy 1992, Stewart et al. 1994). These observations reinforce the difficulty of extrapolating results from studies conducted on seedlings under artificial drought treatments to mature trees under naturally-occurring drought. Harley, P.C. and T.D. Sharkey. 1991. An improved model of photosynthesis at high CO2: Reversed O2 sensitivity explained by lack of glycerate re-entry into the chloroplast. Photosynthesis Research 27:169-178. Harley, P.C., R.B. Thomas, J.F. Reynolds and B.R. Strain. 1992. Modelling photosynthesis of cotton grown in elevated CO2. Plant, Cell and Environment 15:271-282. Jones, H.G. 1985. Partitioning stomatal and non-stomatal limitations to photosynthesis. Plant, Cell and Environment 8:95-104. Ni, B.-R. and S.G. Pallardy. 1992. Stomatal and nonstomatal limitations to net photosynthesis in seedlings of woody angiosperms. Plant Physiology 99:1502-1508. Sharkey, T.D. 1984. Photosynthesis of intact leaves of C3 plants: physics, physiology and rate limitations. Botanical Review 51:53-105. Stewart, J.D., A. Z. El Abidine and P.Y. Bernier. 1994. Stomatal and mesophyll limitations of photosynthesis in black spruce seedlings during multiple cycles of drought. Tree Physiology 15:57-64. Teskey, R.O., J.A. Fites, L.J. Samuelson and B.C. Bongarten. 1986. Stomatal and nonstomatal limitations to net photosynthesis in Pinus taeda L. under different environmental conditions. Tree Physiology 2:131-142. Teskey, R.O., H.L. Gholz and W.P. Cropper, Jr. 1994. Influence of climate and fertilization on net photosynthesis of mature slash pine. Tree Physiology 14:1215-1227. Von Caemmerer, S. and G.D. Farquhar. 1981. Some relationships between the biochemistry of photosynthesis and the gas exchange rates of leaves. Planta 153:376-387. Acknowledgements Drs. Ken Clark and Henry Gholz supplied meteorological and inventory data and valuable discussions. Dr. Nathan Phillips provided schematics and advice for construction of sap flow probes. David Nolletti and Sean Gallagher helped with data collection. Funding was provided by UF's Institute of Food and Agricultural Sciences, the Forest Biology Research Cooperative and a grant from DOE/NIGEC. Rayonier provided access to the study site.


