Outcomes for Children Served through IDEA’s Early Childhood Programs
advertisement
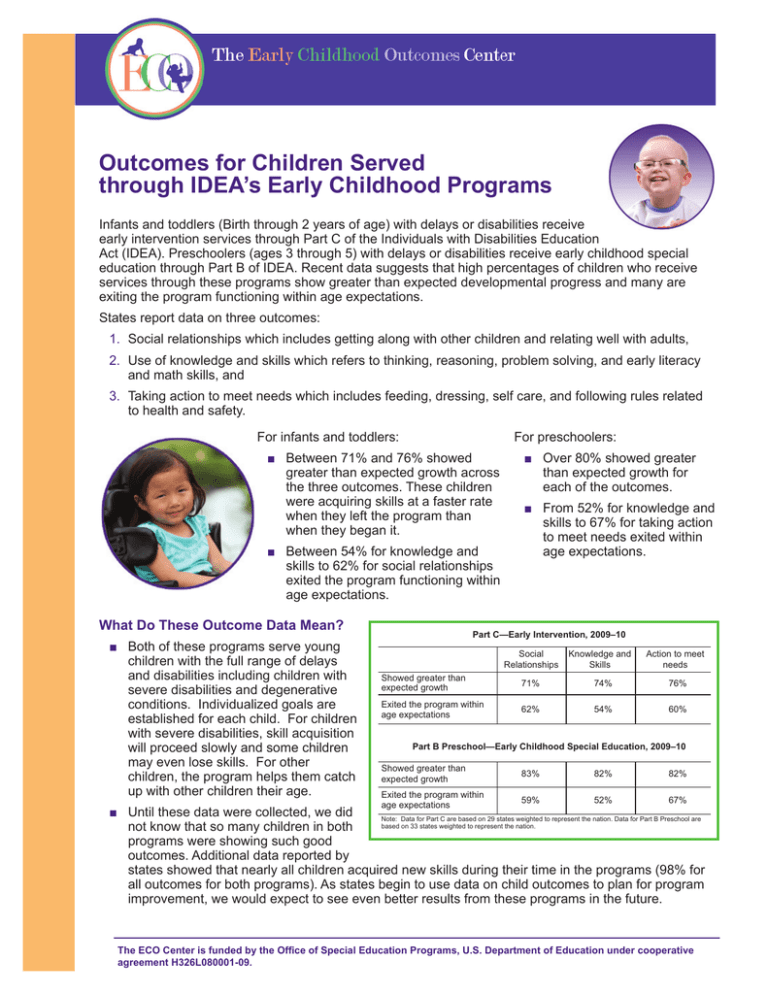
Outcomes for Children Served through IDEA’s Early Childhood Programs Infants and toddlers (Birth through 2 years of age) with delays or disabilities receive early intervention services through Part C of the Individuals with Disabilities Education Act (IDEA). Preschoolers (ages 3 through 5) with delays or disabilities receive early childhood special education through Part B of IDEA. Recent data suggests that high percentages of children who receive services through these programs show greater than expected developmental progress and many are exiting the program functioning within age expectations. States report data on three outcomes: 1. Social relationships which includes getting along with other children and relating well with adults, 2. Use of knowledge and skills which refers to thinking, reasoning, problem solving, and early literacy and math skills, and 3. Taking action to meet needs which includes feeding, dressing, self care, and following rules related to health and safety. For preschoolers: For infants and toddlers: ■ Between 71% and 76% showed greater than expected growth across the three outcomes. These children were acquiring skills at a faster rate when they left the program than when they began it. ■ Between 54% for knowledge and skills to 62% for social relationships exited the program functioning within age expectations. What Do These Outcome Data Mean? ■ Both of these programs serve young children with the full range of delays and disabilities including children with severe disabilities and degenerative conditions. Individualized goals are established for each child. For children with severe disabilities, skill acquisition will proceed slowly and some children may even lose skills. For other children, the program helps them catch up with other children their age. ■ Over 80% showed greater than expected growth for each of the outcomes. ■ From 52% for knowledge and skills to 67% for taking action to meet needs exited within age expectations. Part C—Early Intervention, 2009–10 Social Relationships Knowledge and Skills Action to meet needs Showed greater than expected growth 71% 74% 76% Exited the program within age expectations 62% 54% 60% Part B Preschool—Early Childhood Special Education, 2009–10 Showed greater than expected growth 83% 82% 82% Exited the program within age expectations 59% 52% 67% ■ Until these data were collected, we did Note: Data for Part C are based on 29 states weighted to represent the nation. Data for Part B Preschool are based on 33 states weighted to represent the nation. not know that so many children in both programs were showing such good outcomes. Additional data reported by states showed that nearly all children acquired new skills during their time in the programs (98% for all outcomes for both programs). As states begin to use data on child outcomes to plan for program improvement, we would expect to see even better results from these programs in the future. The ECO Center is funded by the Office of Special Education Programs, U.S. Department of Education under cooperative agreement H326L080001-09. What is Greater than Expected Growth? OSEP Progress Categories as Developmental Trajectories 70 60 e 50 Growth in Outcome Developmental science has provided information about the skills children master at different ages. Knowing what is expected for each age allows us to identify children who are developing too slowly. Children who are substantially behind their peers are described to as having a developmental delay. The solid line on this graph (line e) illustrates typical development. All the other lines represent some kind of delay in the early years. d. Improved functioning to that of same aged peers 40 d 30 e. Functioning like same aged peers c c. Moved closer to functioning like same aged peers b 20 If Angela is 12 months old with the skills of a 6 month b. Improved old, without intervention it is likely that she will continue functioning, no 10 change in trajectory to grow at the same rate, and have the skills of 9 a 0 a. Did not improve month old at 18 months of age. We provide intervention functioning 0 6 12 18 24 30 36 42 48 54 60 66 services because Angela is acquiring skills at about half Age in Months the rate she should be and will continue to fall farther behind. This pattern of growth is illustrated in the b line in the graph. The purpose of intervening is to improve the child’s rate of skill acquisition. The c and d lines illustrate children whose growth was greater than expected because their growth rate with intervention was greater than their growth rate before intervention. The children with growth pattern d catch up to developmental expectations. States report to OSEP the percentage of children in each of the five growth trajectories illustrated in the graph. Background on the Data Collection The Government Performance and Results Act (GPRA) enacted in 1993 requires all federal programs to annually report on program outcomes. GPRA indicators are to be reported annually so that outcomes can be tracked over time. In 2003 the Office of Management and Budget (OMB) Part C—Early Intervention, 2009–10 rated the Part C and Section 619 programs as “results not demonstrated” and recommended Social Relationships Knowledge and Skills Action to meet needs All All Best quality All Best quality Best quality that OSEP establish long-term outcome states states data states data data objectives and develop a strategy to collect Showed greater than 64% 71% 68% 74% 68% 76% expected growth annual performance data in a timely manner. OSEP responded by requiring all states to Exited the program within 65% 62% 56% 54% 62% 60% age expectations develop a measurement strategy to submit the data on child outcomes. Part B Preschool—Early Childhood Special Education, 2009–10 Social Relationships All Best quality states data Knowledge and Skills All Best quality states data Action to meet needs All Best quality states data Showed greater than expected growth 80% 83% 78% 82% 78% 82% Exited the program within age expectations 62% 59% 56% 52% 67% 67% Note: All states for Part C based on 48 states and DC; 2 states did not report data. All states for Part B based on 49 states; one state and DC did not report data. Best quality data refers to the 29 Part C and the 33 Part B states with the highest quality data. Part C—Early Intervention Social Relationships 2008– 09 2009–10 Knowledge and Skills 2008– 09 2009–10 Action to meet needs 2008– 09 2009–10 Showed greater than expected growth 70% 71% 76% 74% 76% 76% Exited the program within age expectations 61% 62% 54% 54% 61% 60% Part B Preschool—Early Childhood Special Education Social Relationships 2008– 09 2009–10 Knowledge and Skills 2008– 09 2009–10 Action to meet needs 2008– 09 2009–10 Showed greater than expected growth 83% 83% 83% 82% 82% 82% Exited the program within age expectations 59% 59% 51% 52% 67% 67% Note: Data for 2008–09 are based on the 19 Part C and the 15 Part B states with the highest quality data. Data for 2009–10 are based on the 29 Part C and 33 Part B states with the highest quality data. All data are weighted to represent the nation. Quality of the Outcomes Data Collecting data on outcomes for young children with disabilities is a complex undertaking and a new activity for states. States are at various stages in implementing procedures for measuring child outcomes data, and not all states were able to report high quality data for 2009–10. The national estimates for 2009–10 were based on the data from the states with the highest quality data under the assumption that the states with poor quality data introduce error into the national estimate. The findings from both methods are presented for comparison. One indication of data quality is stability in the measurement. Analyses based on the high quality states in 2008–09 (19 states for Part C, 15 for Preschool) were compared with those for 2009–10 (up to 29 states for Part C and 33 for Preschool). The numbers are very stable across the two years suggesting that the national estimates based on the states with the highest quality data are credible estimates. Additional information about the measurement of child outcomes is available from the Early Childhood Outcomes Center at www.the-eco-center.org. May 2011
![Service Coordination Toolkit Transition Planning Checklist [ DOC ]](http://s3.studylib.net/store/data/006933472_1-c85cecf2cfb8d9a7f8ddf8ceba8acaf8-300x300.png)
