netherlands Workforce Profile introduction to the netherlands
advertisement
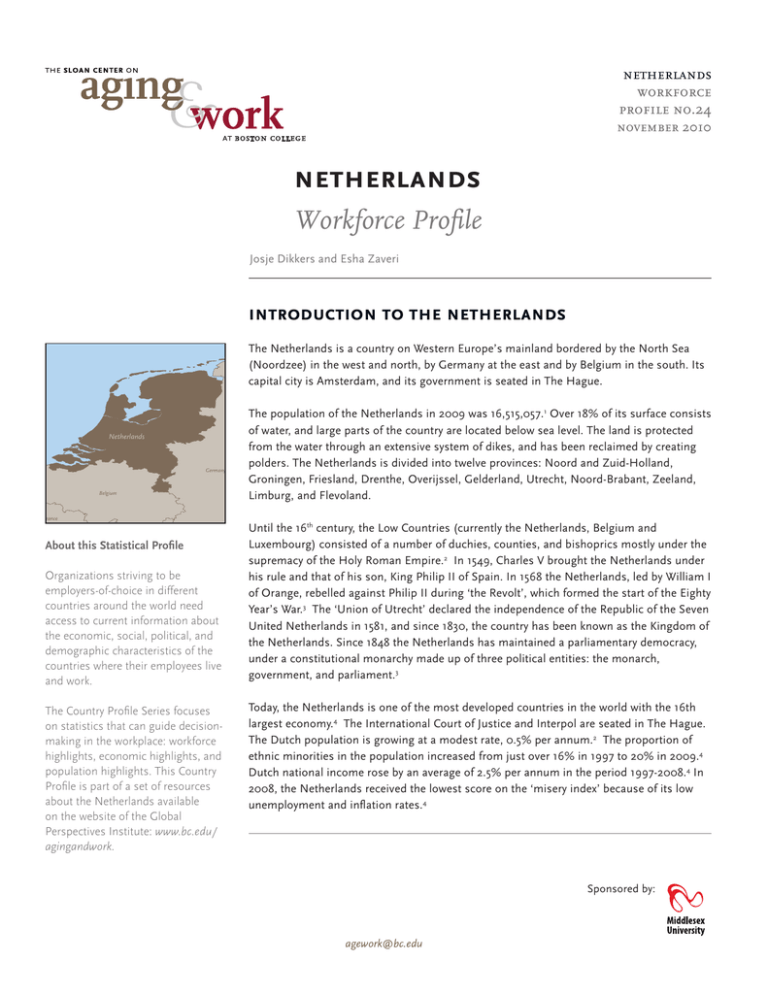
netherlands workforce profile no.24 netherlands workforce profile no.24 november 2010 november 2010 netherlands Workforce Profile Josje Dikkers and Esha Zaveri introduction to the netherlands The Netherlands is a country on Western Europe’s mainland bordered by the North Sea (Noordzee) in the west and north, by Germany at the east and by Belgium in the south. Its capital city is Amsterdam, and its government is seated in The Hague. Netherlands Germany Belgium France About this Statistical Profile Organizations striving to be employers-of-choice in different countries around the world need access to current information about the economic, social, political, and demographic characteristics of the countries where their employees live and work. The Country Profile Series focuses on statistics that can guide decisionmaking in the workplace: workforce highlights, economic highlights, and population highlights. This Country Profile is part of a set of resources about the Netherlands available on the website of the Global Perspectives Institute: www.bc.edu/ agingandwork. The population of the Netherlands in 2009 was 16,515,057.1 Over 18% of its surface consists of water, and large parts of the country are located below sea level. The land is protected from the water through an extensive system of dikes, and has been reclaimed by creating polders. The Netherlands is divided into twelve provinces: Noord and Zuid-Holland, Groningen, Friesland, Drenthe, Overijssel, Gelderland, Utrecht, Noord-Brabant, Zeeland, Limburg, and Flevoland. Until the 16th century, the Low Countries (currently the Netherlands, Belgium and Luxembourg) consisted of a number of duchies, counties, and bishoprics mostly under the supremacy of the Holy Roman Empire.2 In 1549, Charles V brought the Netherlands under his rule and that of his son, King Philip II of Spain. In 1568 the Netherlands, led by William I of Orange, rebelled against Philip II during ‘the Revolt’, which formed the start of the Eighty Year’s War.3 The ‘Union of Utrecht’ declared the independence of the Republic of the Seven United Netherlands in 1581, and since 1830, the country has been known as the Kingdom of the Netherlands. Since 1848 the Netherlands has maintained a parliamentary democracy, under a constitutional monarchy made up of three political entities: the monarch, government, and parliament.3 Today, the Netherlands is one of the most developed countries in the world with the 16th largest economy.4 The International Court of Justice and Interpol are seated in The Hague. The Dutch population is growing at a modest rate, 0.5% per annum.2 The proportion of ethnic minorities in the population increased from just over 16% in 1997 to 20% in 2009.4 Dutch national income rose by an average of 2.5% per annum in the period 1997-2008.4 In 2008, the Netherlands received the lowest score on the ‘misery index’ because of its low unemployment and inflation rates.4 Sponsored by: agework@bc.edu 1 labor force highlights àà In 2009, 80% of the total Dutch population was in the labor force, which includes persons age 15 years and above.5 àà The labor force participation rate in the Netherlands has grown in the past decade, especially among women, older people and members of non-Western ethnic minorities. The government’s target of increasing the number of people in work or seeking employment by a further six percentage points over the coming seven years is ambitious; the target is twice as high as the increase since 2000.4 àà The economically active population in the Netherlands is projected to increase from 9 million in 2009 to 9.3 million in 2020. The “economically active population” comprises all persons of either sex who furnish the supply of labor for the production of goods and services during a specified time reference period.6 àà The ratio of people in work to the number of economically “inactive” people (excluding old age pensioners) has improved; in 1998 there were 32 economically inactive people for every 100 workers, while in 2008 this number had fallen to 25.4 àà The unemployment rate in 2008 was 3.0%.6 àà The unemployment rate among older people (55-64 years) has always been low in the Netherlands, but has increased over the last four years. Because the majority of older unemployed people have little chance of finding work again, the consequences of the present recession are likely to be prolonged for them.4 àà In 2009, the average hours worked by employees in their primary job (either full or part-time) was 30.6 hours compared to 33.7 hours in Denmark and 36.3 hours in Sweden.5 àà In 2008, 36.1% of the employed labor force worked part time.5 àà In 2005, 13.1% of the total employed civilian labor force reported being selfemployed.5 Figure 1a. Employment as Percent of Total Population - Selected Regional Countries, Age 15+, (2009) 80.0 Netherlands 67.4 Belgium 82.2 Denmark 71.0 France 77.6 Germany 85.1 Switzerland 0% A majority of the Dutch population (80%) is employed, compared to 77.6% in Germany and 82.2% in Denmark. 20% 40% 60% 80% 100% Source: OECD, (2010)5 2 http://www.bc.edu/agingandwork netherlands workforce profile no.24 Figure 1b. Employment as Percent of Total Population - Selected GNI Countries, Age 15+, (2009) november 2010 A larger portion of the Dutch population is employed (80%) compared to 77.9% in the United States and 78.5% in the United Kingdom. Netherlands 80.0 Sweden 80.7 United States 77.9 United Kingdom 78.5 76.6 Austria 82.2 Denmark 78.3 Australia 0% 20% 40% 60% 80% 100% Source: OECD, (2010)5 Figure 2. Employment Rate, Ages 15-64, by Gender, the Netherlands and Comparable Nations, 2008 Male 100% 82.3 81.8 In the Netherlands, 81.8% of the male population and 70.2% of the female population is employed. Across all comparable countries more men than women are employed, with the smallest genderemployment gap in Sweden. 80% 70.2 60% Female 85.4 78.1 75.9 74.4 73.5 69.1 68.2 73.1 78.5 76.4 66.8 65.7 66.7 United Kingdom Austria Australia 65.4 64.3 79.6 78.4 60.0 55.7 40% 20% 0% Netherlands Belgium Denmark France Germany Switzerland Sweden United States Source: OECD, (2010)5 Figure 3. Employment Rates in the Netherlands, within Age Groups, 2009 100% 87.1 80% In the Netherlands, employment rates remain high for ages 25-54. Employment rates are higher for younger people (15-24) than older persons (54-64). 60% 86.4 77.3 82.4 58.5 52.6 40% 20% 0% 15-19 20-24 25-34 35-44 45-54 55-64 Source: OECD, (2010)5 agework@bc.edu 3 Figure 4. Employment Rates in the Netherlands Compared to Selected Regional Countries, within Age Groups, 2009 100% Netherlands Denmark 80% Germany Belgium 60% France 40% 20% 0% In 2009, the Dutch employment rates across age groups were fairly similar to its neighbors with a notable difference in the youngest age groups (age15-29), where the Netherlands has the highest employment rate followed closely by Denmark. 15-19 20-24 25-29 30-34 35-39 40-44 45-49 50-54 55-59 60-64 65-69 Source: OECD, (2010)5 Figure 5a. Current and Projected Economically Active Population Rates in the Netherlands, within Age Groups, 2009 and 2020 100% 90.3 91.8 94.0 90.9 93.9 90.0 89.5 91.7 83.1 83.8 87.8 89.5 83.9 2009 2020 86.6 Current projections do not indicate much variation in the economically active population between now and 2020. However, the most notable increases are seen in the 55-64 age group. 78.1 80% 72.8 68.1 64.5 60% 42.1 40% 35.7 20% 6.4 0% 15-19 20-24 25-29 30-34 35-39 40-44 45-49 50-54 55-59 60-64 8.4 65+ Source: International Labor Organization, (2010)6 Figure 5b. Current and Projected Economically Active Population as % of Total Population in the Netherlands by Gender, 2009 and 2020 2009 Male 4.0 2009 Female 3.8 27.5 2020 Female 3.9 0% 20% 45+ 25.1 25.9 10% 20-44 17.8 28.5 2020 Male 4.2 15-19 23.8 31.5 20.1 30% 40% 50% 60% Source: International Labor Organization, (2010)6 4 http://www.bc.edu/agingandwork netherlands workforce profile no.24 november 2010 economic highlights àà Gross Domestic Product per capita in the Netherlands was estimated at $39,500 in 2009, compared to $36,800 for Belgium and $34,100 for Germany. The GDP per capita is somewhat less than that of the US which is $46,400.7 àà In 2007 the Dutch GDP grew by 3.9%.8 Since 2008 the global financial crisis has hit the Netherlands hard. GDP grew by 1.9% in 2008 but declined by 4% in 2009. The economy is making a slow recovery in 2010, however with an estimated growth rate of 1.25%.9 Figure 6. GDP Growth, Regional Comparisons, 1990-2008 6 During the late 90’s the Netherlands surpassed its neighbors in GDP growth. There was a slump from 2000-2003, but the GDP grew considerably thereafter till 2007. Netherlands 5 Germany 4 Belgium 3 France 2 1 0 2008 2007 2006 2005 2004 2003 2002 2001 2000 1999 1997 1998 1995 1996 1993 1994 1991 1992 1990 -1 *GDP growth figure for Germany in 2002 from OECD is missing. Source: OECD, (2010)5 Figure 7. Total External Debt as Percentage of GDP, Selected Regional Countries, 1992-2008 150% Netherlands Germany 120% France 90% 2008 2007 2006 2004 2003 2002 2001 2000 1999 1997 1998 1996 1995 1994 1993 30% 2005 60% 1992 Dutch debt has seen a gradual decline since 1993, but has begun to rise since 2007. Belgium Source: OECD, (2010)5 agework@bc.edu 5 Income Facts about the Netherlands • The average household income in the Netherlands increased between 1997 and 2007. Couples with children and single-parent families have seen a proportionally strong rise in their incomes since the beginning of the present decade.4 • Income inequality has remained fairly stable since 1997. The poverty rate has declined slightly.4 • The total number of benefit recipients remained fairly constant between 1998 and 2008, at between 3.9 and 4.1 million. The rise in the number of people in receipt of old-age pension is offset by a fall in those claiming disability benefits, social assistance benefits, and surviving dependants’ benefits.4 • In late 2008/early 2009, 59 % of Dutch citizens were “satisfied” with their incomes. The satisfaction rate was higher among pensioners (71%), and substantially lower among benefit recipients younger than 65 years (28%).4 • In 2008-2009, 72% of the Dutch population held the view that income differentials should be reduced.4 6 http://www.bc.edu/agingandwork netherlands workforce profile no.24 november 2010 demographic highlights àà In 2009, the Dutch population was 16,418,000, compared to 10,542,000 for Belgium and 5,473,000 for Denmark.5 àà In 2007, 4.2% of the population was of non–Dutch descent.5 àà The fertility rate in the Netherlands in 2010 is estimated at 1.66 children born/woman (compared to the US and German rates at 2.06 and 1.42, respectively).7 àà In 2008, 14.8% of the population in the Netherlands was over the age of 65 compared to 17.2% in Belgium and 13.7% in Australia.7 Figure 8. Median Age, by Gender (Country Comparisons, 2010) Netherlands 40.0 36.8 Australia 40.7 43.0 39.8 38.2 Male Belgium Germany Denmark 41.6 38.3 France 43.3 Female 45.6 41.6 41.2 0 10 20 30 40 50 Source: CIA, (2010)7 Figure 9. Life Expectancy at Birth (Country Comparisons, 2010) Netherlands 76.9 79.3 76.2 76.4 76.1 77.9 Male The life expectancy at birth in the Netherlands is 76.9 for men and 82.3 for women. (See Figure 9) Australia Belgium Germany Denmark 82.3 84.3 82.7 82.6 81.0 84.4 Female 0 Source: CIA, (2010) 20 40 60 80 France 100 7 agework@bc.edu 7 àà In the Netherlands, 19.8% of the male population and 23.5% of the female population is 60+ years.10 In comparison: • In Belgium, 21.3% of the male population and 26.5% of the female population is 60+. • In Australia, 18.1% of the male population and 20.6% of the female population is 60+. àà In the Netherlands the highest percentage of people, both male and female, are in their 40’s. Also, the percentage of women in each age group 65+ is higher than men. Belgium and Australia show a similar trend.10 (See Figures 10a-10c) Figure 10a. Population Distribution of Netherlands, 2010 Male Female 80+ 75-79 70-74 65-69 60-64 55-59 50-54 45-49 40-44 35-39 30-34 25-29 20-24 15-19 10-14 5-9 0-4 10% 8% 6% 4% Source: US Census Bureau, (2010)10 8 2% 0% 0% 2% 4% 6% % of Population http://www.bc.edu/agingandwork 8% 10% netherlands workforce profile no.24 Figure 10b. Population Distribution of Belgium, 2010 Male Female november 2010 80+ 75-79 70-74 65-69 60-64 55-59 50-54 45-49 40-44 35-39 30-34 25-29 20-24 15-19 10-14 5-9 0-4 10% 8% 6% 4% 2% 0% 0% 2% 4% 6% 8% 10% 8% 10% % of Population Source: US Census Bureau, (2010)10 Figure 10c. Population Distribution of Australia, 2010 Male Female 80+ 75-79 70-74 65-69 60-64 55-59 50-54 45-49 40-44 35-39 30-34 25-29 20-24 15-19 10-14 5-9 0-4 10% 8% 6% 4% Source: US Census Bureau, (2010)10 agework@bc.edu 2% 0% 0% 2% 4% 6% % of Population 9 Work and Family in the Netherlands • A growing proportion of the Dutch population, 20-65 years, balanced paid work with care tasks at home (38%) in 2005. Women most often combined work-home tasks.4 • Among working women, 56% regularly feel rushed, and many, (31%) think they fall short on the “home front.” These feelings are slightly less common among working men (45% and 21%, respectively).4 • The time that parents devote to their children (aged up to five years) is almost 21 hours per week for women and 10 hours per week for men, but is increasing. Internationally, the Dutch take the lead in the amount of time they spend with their children.4 10 http://www.bc.edu/agingandwork netherlands workforce profile no.24 november 2010 references 1 Central Bureau of Statistics (CBS). (2010). Population. Retrieved September 29, 2010 from: http://www.cbs. nl/nl-NL/menu/themas/bevolking/cijfers/extra/bevolkingsteller.htm 2 Arblaster, P. (2006). A history of the low countries. New York: Palgrave Macmillan. 3 Blok, P. J. (1898-1912). History of the people of the Netherlands (5 vols). Retrieved August 10, 2010 from http:// www.archive.org/stream/historyofpeopleo05blokuoft#page/n9/mode/2up 4 The Netherlands Institute for Social Research (SCP). (2010). Social state of the Netherlands 2009 (scp-publication 2010/6). The Hague: SCP. 5 Organization for Economic Co-Operation and Development. (2010). StatExtracts. Country statistical profiles. Retrieved July 19, 2010 from: http://stats.oecd.org/Index.aspx 6 International Labor Organization. (2010). LABORSTA internet. Retrieved July 19, 2010 from: http://laborsta. ilo.org/ 7 The Central Intelligence Agency. (2010).The world factbook 2010. Retrieved August 9, 2010 from: https://www. cia.gov/library/publications/the-world-factbook/geos/nl.html 8 Eurostat. (2010). Statistics database. Retrieved August 9, 2010 from: http://epp.eurostat.ec.europa.eu/portal/ page/portal/product_details/dataset?p_product_code=TSIEB020 9 U.S. Department of State. (2010). Background note: Netherlands. Retrieved August 9, 2010 from: http://www. state.gov/r/pa/ei/bgn/3204.htm 10 US Census Bureau. (2010). International database. Retrieved August 9, 2010 from: http://www.census.gov/ ipc/www/idb/ agework@bc.edu 11 about the institute Established in 2007 by the Sloan Center on Aging & Work at Boston College, the Global Perspectives Institute is an international collaboration of scholars and employers committed to the expansion of the quality of employment available to the 21st century multi-generational workforce in countries around the world. The Global Perspectives Institute focuses on innovative and promising practices that might be adopted by employers and policy-makers. The Institute’s research, publications, and international forums contribute to: àà a deeper understanding of the employment experiences and career aspirations of employees of different ages who work in countries around the world; àà informed decision making by employers who want to be employers-of-choice in different countries; and àà innovative thinking about private-public partnerships that promote sustainable, high-quality employment. The Sloan Center on Aging & Work at Boston College promotes quality of employment as an imperative for the 21st century multi-generational workforce. We integrate evidence from research with insights from workplace experiences to inform innovative organizational decision making. Collaborating with business leaders and scholars in a multi-disciplinary dialogue, the Center develops the next generation of knowledge and talent management. The Sloan Center on Aging & Work is grateful for the continued support of the Alfred P. Sloan Foundation. Josje Dikkers is assistant professor at the Department of Organizational Behavior and Development of the VU University Amsterdam. Josje Dikkers graduated, cum laude, in 2001 with a specialization in Work & Organizational Psychology at Tilburg University. Subsequently, she worked at the Department of Work & Organizational Psychology of the Radboud University Nijmegen on her PhD project which focused on the interaction between people’s work and private life in relation to organizational, work and home characteristics, which she successfully defended in 2008. Her research interests focus on the interaction between work and wellbeing, and more specifically on HRM-policies facilitating work-home balance. Luísa de Azevedo has a bachelor’s degree in Economics from the Federal University of Rio de Janeiro. She first started working with research in 2005, participating as an assistant in projects mainly with regards to the Brazilian labor market. She was part of the research team of Ricardo Paes de Barros at IPEA and is currently a junior researcher at IETS. Her latest work in the field of labor markets was a monthly bulletin on entrepreneurship in Rio de Janeiro, developed with other senior researchers from IETS. Esha Zaveri is a graduate student in the Department of Economics at Boston College. Her research interests lie in applied microeconomics with a focus on developing countries. 12 http://www.bc.edu/agingandwork Country Context Team Leaders Marcie Pitt-Catsouphes, Director, Sloan Center on Aging and Work Tay K. McNamara, Director of Research, Sloan Center on Aging and Work Jungui Lee, Postdoctoral researcher, Sloan Center on Aging and Work netherlands workforce profile no.24 november 2010 For additional Sloan Center publications, visit our website at www.bc.edu/agingandwork Country Workforce Profile 01 - Japan Country Workforce Profile 02 - United States Country Workforce Profile 03 - Pakistan Country Workforce Profile 04 - South Korea Country Workforce Profile 05 - China Country Workforce Profile 06 - Greece Country Workforce Profile 07 - Armenia Country Workforce Profile 08 - Italy Country Workforce Profile 09 - Singapore Country Workforce Profile 10 - Denmark Country Workforce Profile 11 - South Africa Country Workforce Profile 12 - India agework@bc.edu Country Workforce Profile 13 - Kenya Country Workforce Profile 14 - Australia Country Workforce Profile 15 - Germany Country Workforce Profile 16 - France Country Workforce Profile 17 - Sweden Country Workforce Profile 18 - United Kingdom Country Workforce Profile 19 - Spain Country Workforce Profile 20- Ireland Country Workforce Profile 21 - Mexico Country Workforce Profile 22 - NIgeria Country Workforce Profile 23 - Brazil 13

