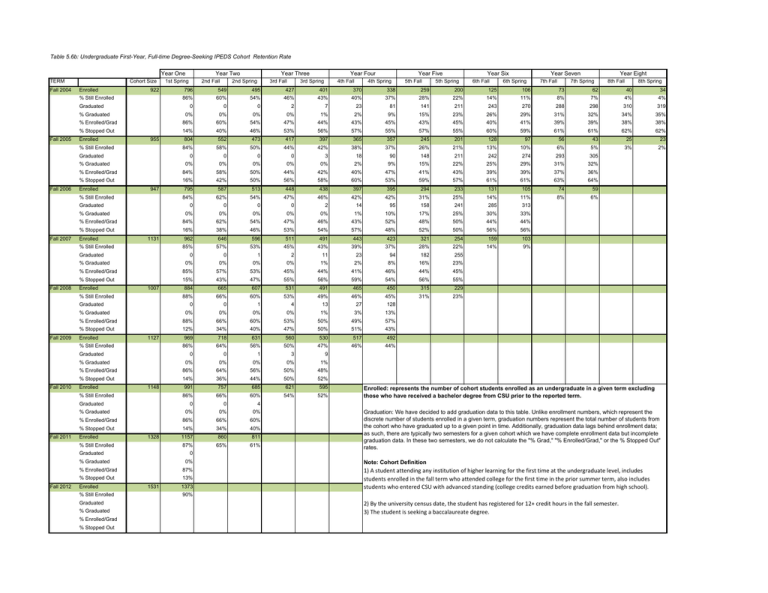
Table 5.6b: Undergraduate First-Year, Full-time Degree-Seeking IPEDS Cohort Retention... Year One TERM Cohort Size
advertisement

Table 5.6b: Undergraduate First-Year, Full-time Degree-Seeking IPEDS Cohort Retention Rate Year Two Year One TERM Fall 2004 Cohort Size Enrolled 922 % Still Enrolled Graduated Year Six 5th Spring 6th Fall Year Seven 6th Spring 7th Fall Year Eight 7th Spring 8th Fall 8th Spring 796 549 495 427 401 370 338 259 200 125 106 73 62 40 34 86% 60% 54% 46% 43% 40% 37% 28% 22% 14% 11% 8% 7% 4% 4% 2 7 23 81 141 211 243 270 288 298 310 319 1% 2% 9% 15% 23% 26% 29% 31% 32% 34% 35% % Enrolled/Grad 86% 60% 54% 47% 44% 43% 45% 43% 45% 40% 41% 39% 39% 38% 38% % Stopped Out 14% 40% 46% 53% 56% 57% 55% 57% 55% 60% 59% 61% 61% 62% 62% 804 552 473 417 397 365 357 245 201 128 97 56 43 25 23 84% 58% 50% 44% 42% 38% 37% 26% 21% 13% 10% 6% 5% 3% 2% Enrolled 955 0 0 0 0 3 18 90 148 211 242 274 293 305 0% 0% 0% 0% 0% 2% 9% 15% 22% 25% 29% 31% 32% % Enrolled/Grad 84% 58% 50% 44% 42% 40% 47% 41% 43% 39% 39% 37% 36% % Stopped Out 16% 42% 50% 56% 58% 60% 53% 59% 57% 61% 61% 63% 64% 795 587 513 448 438 397 395 294 233 131 105 74 59 84% 62% 54% 47% 46% 42% 42% 31% 25% 14% 11% 8% 6% 0 0 0 0 2 14 95 158 241 285 313 Enrolled 947 % Enrolled/Grad % Stopped Out Enrolled 1131 % Still Enrolled Graduated % Graduated % Enrolled/Grad % Stopped Out Enrolled 1007 % Still Enrolled Graduated % Graduated % Enrolled/Grad % Stopped Out Enrolled 1127 % Still Enrolled Graduated % Graduated % Enrolled/Grad % Stopped Out Enrolled 1148 % Still Enrolled Graduated % Graduated % Enrolled/Grad % Stopped Out Enrolled 1328 % Still Enrolled Graduated 0% 0% 0% 0% 0% 1% 10% 17% 25% 30% 33% 84% 62% 54% 47% 46% 43% 52% 48% 50% 44% 44% 16% 38% 46% 53% 54% 57% 48% 52% 50% 56% 56% 962 646 596 511 491 443 423 321 254 159 103 85% 57% 53% 45% 43% 39% 37% 28% 22% 14% 9% 0 0 1 2 11 23 94 182 255 0% 0% 0% 0% 1% 2% 8% 16% 23% 85% 57% 53% 45% 44% 41% 46% 44% 45% 15% 43% 47% 55% 56% 59% 54% 56% 55% 884 665 607 531 491 465 450 315 229 88% 66% 60% 53% 49% 46% 45% 31% 23% 0 0 1 4 13 27 128 0% 0% 0% 0% 1% 3% 13% 88% 66% 60% 53% 50% 49% 57% 12% 34% 40% 47% 50% 51% 43% 969 718 631 560 530 517 492 86% 64% 56% 50% 47% 46% 44% 0 0 1 3 9 0% 0% 0% 0% 1% 86% 64% 56% 50% 48% 14% 36% 44% 50% 52% 991 757 685 621 595 86% 66% 60% 54% 52% 0 0 4 0% 0% 0% 86% 66% 60% 40% 14% 34% 1157 860 811 87% 65% 61% 0% % Enrolled/Grad 87% % Stopped Out 13% Enrolled % Still Enrolled Graduated % Graduated % Enrolled/Grad % Stopped Out 55% 4% 6% 11% 30% Enrolled: represents the number of cohort students enrolled as an undergraduate in a given term excluding 47% those who have received a bachelor degree from CSU prior to the reported term. Graduation: We have decided to add graduation data to this table. Unlike enrollment numbers, which represent the discrete number of students enrolled in a given term, graduation numbers represent the total number of students from the cohort who have graduated up to a given point in time. Additionally, graduation data lags behind enrollment data; as such, there are typically two semesters for a given cohort which we have complete enrollment data but incomplete graduation data. In these two semesters, we do not calculate the "% Grad," "% Enrolled/Grad," or the % Stopped Out" rates. 0 % Graduated Fall 2012 5th Fall 0% % Graduated Fall 2011 Year Five 4th Spring 0 Graduated Fall 2010 4th Fall 0% % Still Enrolled Fall 2009 Year Four 3rd Spring 0 % Graduated Fall 2008 3rd Fall 0% Graduated Fall 2007 Year Three 2nd Spring 0 % Still Enrolled Fall 2006 2nd Fall 0% % Graduated Fall 2005 1st Spring 1531 Note: Cohort Definition 1) A student attending any institution of higher learning for the first time at the undergraduate level, includes students enrolled in the fall term who attended college for the first time in the prior summer term, also includes students who entered CSU with advanced standing (college credits earned before graduation from high school). 1373 90% 67% 2) By the university census date, the student has registered for 12+ credit hours in the fall semester. 3) The student is seeking a baccalaureate degree.


